
The 13 Week Cash Flow Model Everything You Need to Know
13-Week Cash Flow Planning: Tips, Tricks, and Essentials
Most businesses find out they have a cash problem the same way: a payment they were counting on doesn’t land, and suddenly payroll is three days away with not enough in the account to cover it. A 13-week cash flow model exists to remove that surprise. It gives you a week-by-week view of exactly when cash comes in and when it goes out, far enough ahead that you can actually do something about a shortfall instead of just reacting to one.
This guide covers what the model is, how to build one properly, the mechanics most guides skip (working capital roll-forwards, EBITDA-to-cash reconciliation, borrowing base tracking), and the mistakes that quietly make a model useless.
What a 13-week cash flow model actually is
A 13-week cash flow model is a rolling, weekly forecast of cash receipts and cash disbursements over the next 13 weeks, roughly one fiscal quarter. It uses the direct method: instead of starting from accrual-based net income and adjusting it, you forecast actual cash moving in and cash moving out, week by week, and net the two to get a cash position.
That direct-method approach is what makes it different from a standard monthly forecast. A monthly forecast built on accrual accounting can show a healthy profit in a month where the business still runs out of cash, because revenue was recognized before the invoice was ever paid. A 13-week model only cares about when money physically moves, which is exactly the information you need when liquidity is tight.
Why 13 weeks, specifically
Thirteen weeks isn’t an arbitrary number. It’s the length of a fiscal quarter, which means the model naturally aligns with quarterly board meetings, lender covenant checks, and investor updates. It’s also short enough that near-term forecasts stay reasonably accurate (you’re working mostly from known invoices, signed contracts, and scheduled payments) while still giving you enough runway to act on a problem before it becomes a crisis.
Other horizons exist, and picking the wrong one is a common mistake:
| Horizon | Best for | Limitation |
| 10 to 15 business days | Companies actively managing a credit line or facing an imminent shortfall | Too short to catch problems more than two weeks out |
| 13 weeks (rolling) | Ongoing liquidity management, lender reporting, quarterly planning | Not built for long-range decisions like capex or expansion |
| 6-month hybrid (13 weeks + 3 monthly buckets) | Businesses that need near-term precision plus a longer runway view | More maintenance; requires two levels of granularity |
| Annual budget | Strategic and capital planning | Too coarse to catch a week-level cash gap |
If your business is in genuine distress and negotiating with lenders week to week, a 13-week model might even be too long a horizon on its own, and you’d pair it with a tighter 10 to 15 day view for the immediate weeks. Most healthy businesses using this model for ongoing visibility are fine with the standard 13-week rolling window.
Who uses it, and why
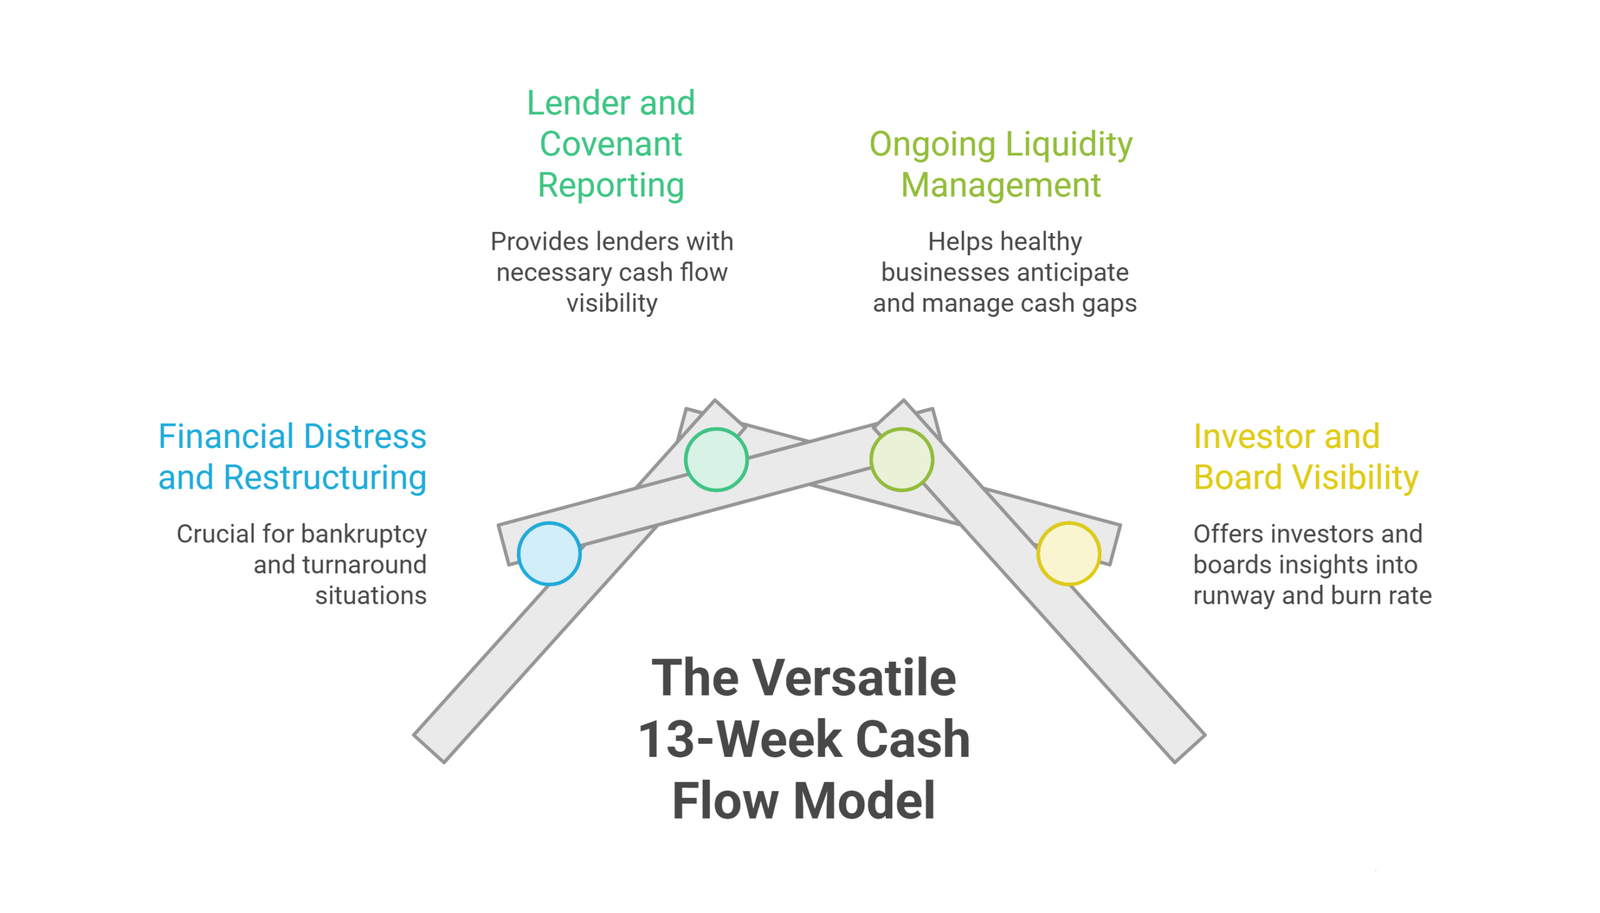
The model shows up in a few distinct situations, and the stakes are different in each:
Financial distress and restructuring. This is where the 13-week model originated. In turnaround and bankruptcy situations, it’s often the single most important document in the room. It shows creditors, lenders, and the court exactly how much cash is available, when it runs out under current assumptions, and how much new financing (debtor-in-possession financing, in a bankruptcy context) would be needed to keep operating. A credible model here can directly influence whether a court approves financing or a lender extends a facility.
Lender and covenant reporting. Outside of distress, many credit agreements require ongoing cash flow reporting as a condition of the loan. A 13-week model gives lenders the granular visibility they want without asking a company to hand over its entire financial system.
Ongoing liquidity management. Plenty of healthy, non-distressed businesses run a rolling 13-week model simply because it’s the best tool for catching a cash gap early: seasonal dips, a large customer paying late, a big one-off payment landing in the same week as payroll. For companies without a dedicated finance team, this is often one of the first things a fractional CFO sets up.
Investor and board visibility. Investors, especially in venture-backed or PE-owned companies, use the 13-week view to sanity-check runway and burn rate assumptions between formal reporting periods.
The core structure
Every 13-week model, regardless of industry, is built around three sections:
- Cash inflows: customer receipts, financing draws, asset sales, tax refunds, and any other cash coming into the business
- Cash outflows: payroll, accounts payable, rent, taxes, debt service, and other disbursements
- Net cash flow and cash position: inflows minus outflows for the week, rolled into a running beginning and ending cash balance
Most well-built models break this down into 15 to 30 line items, granular enough to catch real timing issues (like payroll landing the same week as a large vendor payment) without becoming so detailed that updating it every week turns into a part-time job.
Assigning ownership before you build anything
Before a single formula goes into a spreadsheet, decide who owns the model. This gets skipped constantly, and it’s usually why a model dies after three weeks. Someone needs to be responsible for updating it, chasing down actuals from accounting and sales, flagging variances, and communicating findings to leadership. That person needs enough financial literacy to spot when an assumption looks wrong, and enough authority (or a clear escalation path) to raise a concern before it becomes a crisis. In smaller companies without in-house finance capacity, this is one of the more common reasons owners bring in a fractional CFO specifically to stand up and maintain the model.
Building the model: step by step
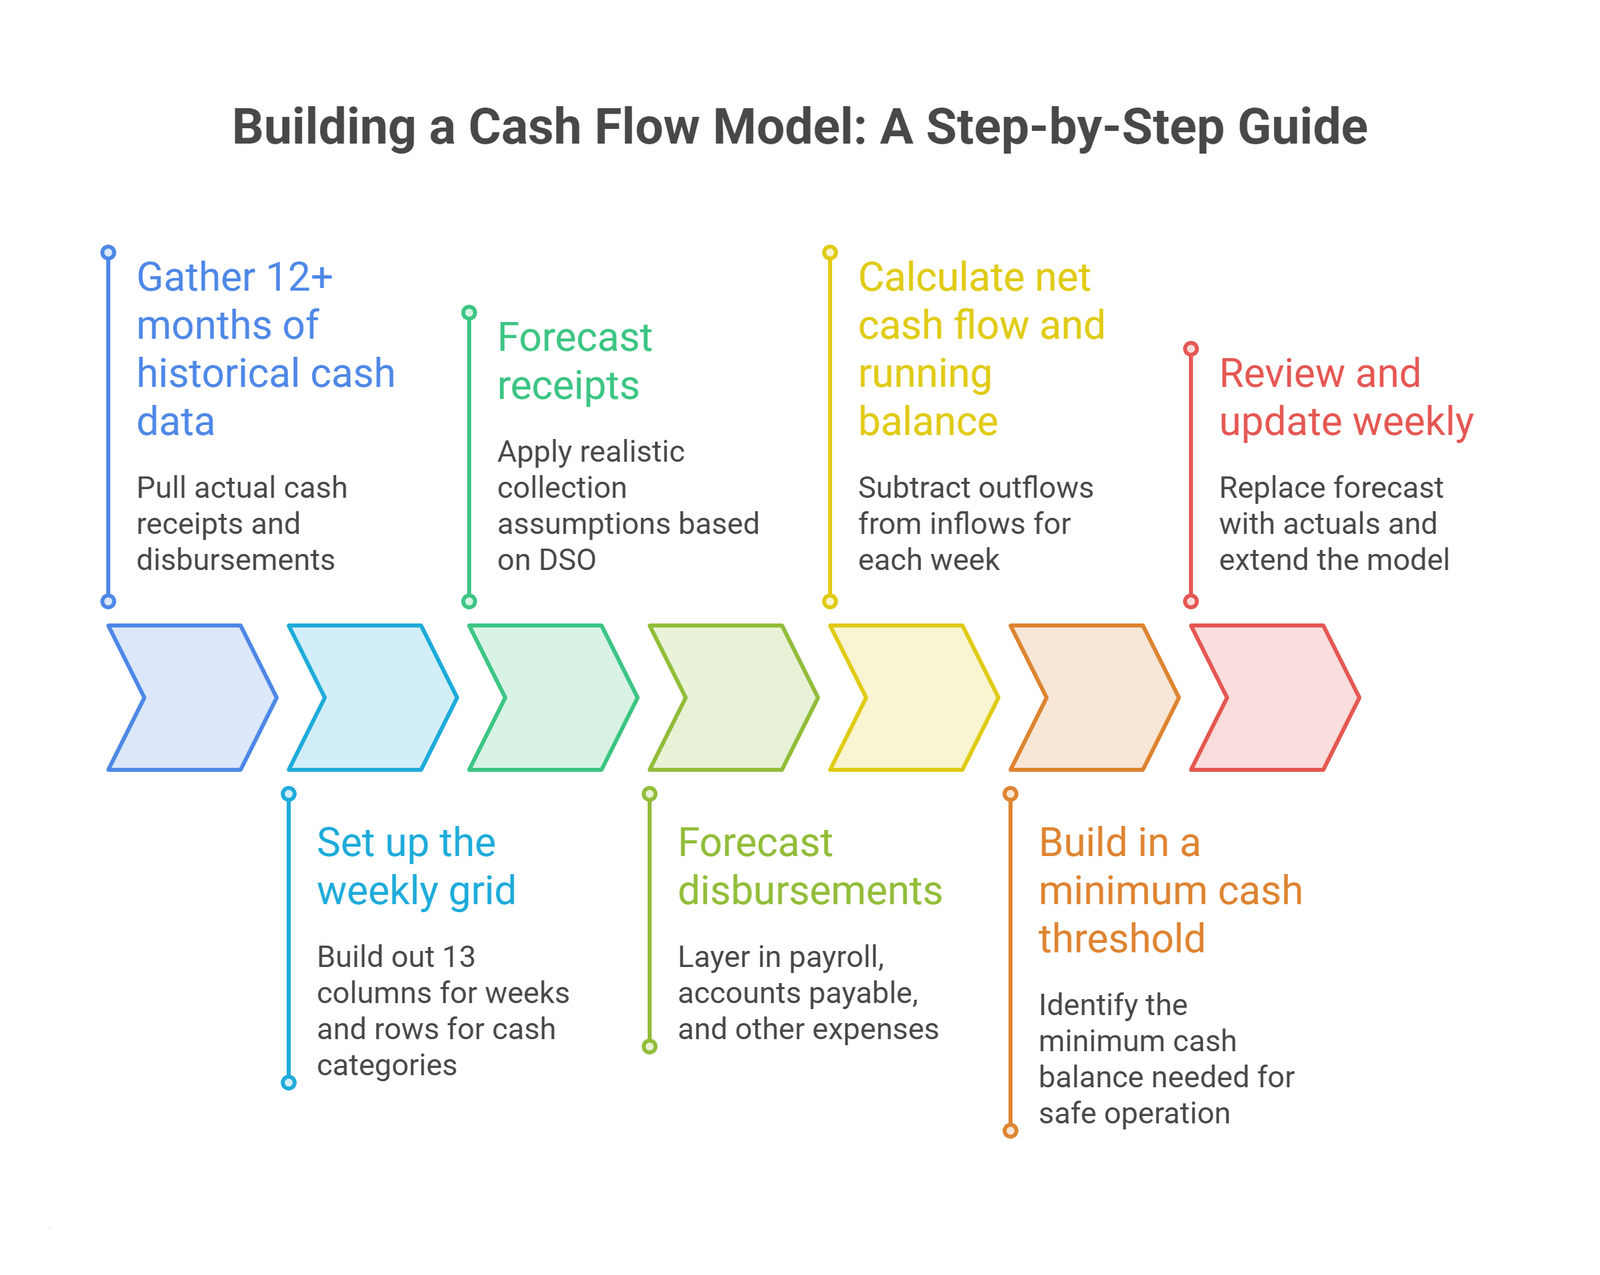
1. Gather 12+ months of historical cash data. Pull actual cash receipts and disbursements from bank statements and your accounting system, not just revenue and expense figures from the income statement. You’re looking for patterns: how long customers actually take to pay versus their stated terms, which weeks of the month vendor payments cluster in, and how payroll timing interacts with everything else.
2. Set up the weekly grid. Build out 13 columns, one per week, with rows for each cash inflow and outflow category, plus beginning and ending cash balance for each week.
3. Forecast receipts. Start with your accounts receivable aging and apply realistic collection assumptions based on actual historical days sales outstanding (DSO), not stated payment terms. For larger customers, use invoice-level assumptions where you have visibility into their specific payment behavior.
4. Forecast disbursements. Layer in payroll (a fixed, predictable weekly or biweekly item), accounts payable based on vendor terms and historical payment timing, rent, debt service, taxes, and any known one-off payments.
5. Calculate net cash flow and running balance. Subtract outflows from inflows for each week, then roll that into a continuous beginning-to-ending cash balance across all 13 weeks.
6. Build in a minimum cash threshold. Identify the minimum cash balance your business needs to operate safely, and flag any week where the forecast dips below it. This is usually the single most useful output of the whole exercise.
7. Review and update weekly. As each week closes, replace the forecast with actuals, extend the model one more week forward, and compare what actually happened against what you predicted.
Direct method vs. indirect method
The 13-week model uses the direct method exclusively, but it’s worth understanding why, since it’s the detail people get wrong most often.
The direct method forecasts actual cash receipts and cash disbursements: money customers pay you, money you pay vendors, payroll, rent. It answers “what cash is moving, and when.”
The indirect method starts from net income and adjusts for non-cash items (depreciation, changes in working capital) to arrive at cash flow from operations. It’s how the cash flow statement in your financial statements is typically built, and it’s useful for tying cash flow back to profitability, but it’s far less precise at the weekly level because it’s built on monthly or quarterly accrual data.
For a 13-week model, direct method wins because you need to know that payroll hits on Friday and a big customer payment might not land until the following Tuesday. Indirect method can’t give you that granularity.
Working capital roll-forwards: the mechanic most guides skip
This is where a genuinely useful model separates itself from a rough estimate. Rather than just plugging in a guess for “collections” each week, a properly built model roll-forwards the balance sheet items that drive cash timing:
- Accounts receivable roll-forward: opening AR balance, plus new invoices billed during the week, minus cash collected, equals ending AR. This forces you to reconcile your collections assumption against an actual, trackable balance instead of a gut-feel number.
- Accounts payable roll-forward: opening AP balance, plus new bills received, minus payments made, equals ending AP. Same logic in reverse.
- Inventory roll-forward (for product businesses): opening inventory, plus purchases, minus cost of goods sold, equals ending inventory, which in turn drives the timing of vendor payments.
Building these roll-forwards takes more setup time than a flat estimate, but it’s what makes a model auditable. When a lender or investor asks “how did you get to this collections number,” you can point to the actual AR balance and assumption, not a placeholder.
Reconciling cash to EBITDA
A cash-only model is powerful, but on its own it can leave leadership without a mental bridge back to the profit and loss statement. An EBITDA-to-cash reconciliation solves this: starting from projected EBITDA, you walk through the timing differences (change in receivables, change in payables, capital expenditures, debt service, taxes paid) that separate profit from actual cash movement.
This matters most in restructuring or lender conversations, where stakeholders are used to thinking in EBITDA and need to understand exactly why a profitable-looking business can still be short on cash in a given week.
Borrowing base and revolver tracking
If your business draws on a revolving credit facility or asset-based lending arrangement, your 13-week model should track the borrowing base alongside cash. The borrowing base (typically a formula-driven percentage of eligible receivables and inventory) determines how much you can actually draw, independent of your cash balance. A model that only shows cash and ignores available borrowing capacity can miss the real story: a company might show a cash shortfall in week 6 that’s entirely solvable with an available revolver draw, or conversely, look fine on cash while quietly running out of borrowing base room.
Rolling forecast, not a static one
A 13-week model is only useful if it stays a rolling forecast. As week one closes and you replace its forecast with actuals, you add a new thirteenth week onto the far end, so you always have a full quarter of forward visibility. A static forecast, built once and left alone, degrades fast: by week 6 or 7, you’re operating on assumptions that are increasingly disconnected from what’s actually happening in the business. Most finance teams update the rolling forecast weekly, though every two weeks can work for lower-volatility businesses.
Scenario planning as a formal step
Don’t treat scenario planning as an afterthought or a footnote. Build at least two alternate cases alongside your base case: a downside scenario (a major customer pays late, a sales forecast doesn’t materialize) and, where relevant, an upside scenario (an early payment, faster-than-expected collections). Running these as a formal part of the process, not a one-off exercise you do only when things look shaky, means you already know your response plan before a shortfall actually shows up in the numbers.
Common mistakes that quietly break the model
- Using stated payment terms instead of actual collection behavior. If a customer’s terms say net 30 but they consistently pay in 45, your model will show cash that isn’t really there.
- Skipping the working capital roll-forwards and plugging in flat weekly estimates instead, which makes the model impossible to audit or defend.
- Treating it as a one-time exercise. A 13-week model that isn’t updated weekly with actuals is stale by week three.
- Ignoring one-off or lumpy items. Annual insurance payments, quarterly tax deposits, and one-time vendor payments have an outsized effect on a weekly model and are easy to forget until they hit.
- No minimum cash threshold. Without a defined floor, it’s hard to tell whether a dip in the forecast is a real problem or normal noise.
- Skipping scenario planning entirely, which leaves leadership with only a single-point forecast and no plan if reality diverges from it.
Frequently Asked Questions
How is a 13-week cash flow model different from a regular cash flow forecast?
A regular cash flow forecast is often monthly or quarterly and can be built using the indirect method from accrual data. A 13-week model is specifically weekly, uses the direct method, and is built for near-term liquidity visibility rather than longer-range planning.
Do only distressed companies need a 13-week cash flow model?
No. While the model originated in restructuring and bankruptcy contexts, plenty of healthy businesses run one on a rolling basis simply for tighter liquidity visibility, especially seasonal businesses or those with lumpy customer payment patterns.
How often should the model be updated?
Weekly is standard. As each week closes, replace its forecast with actual results and add a new week to the far end so you always have 13 weeks of forward visibility.
What’s the minimum number of line items a model needs?
Most effective models land between 15 and 30 line items across inflows and outflows. Fewer than that and you lose the granularity that catches timing problems; more than that and weekly updates become unsustainably time-consuming.
Can a small business build one without dedicated finance staff?
Yes, with a solid Excel template and a clear owner, but the working capital roll-forwards and borrowing base tracking are where most self-built models fall short. This is a common point where businesses bring in outside financial expertise to get the model built correctly the first time.
Conclusion
A 13-week cash flow model is one of the highest-leverage tools available for staying ahead of a liquidity problem instead of discovering it the hard way. The version that actually works isn’t just a spreadsheet with 13 columns; it’s a properly built, weekly-updated model with real working capital roll-forwards, a defined owner, and scenario planning built in from the start. Businesses evaluating major purchases alongside their cash flow planning should also look at how those decisions interact with capital budgeting and the broader distinction between operating and capital budgets, since a capital purchase can materially change a 13-week cash picture in ways a simple operating forecast won’t catch.
If building and maintaining this model in-house isn’t realistic right now, that’s exactly the kind of work a fractional CFO is built to take off your plate, from the initial build through the weekly discipline of keeping it accurate.