SDG 17: Partnerships for the Goals, and the Year Foreign Aid Collapsed
The decade closes with the largest aid cut on record
Global aid did not slow down in 2025. It collapsed.
Official development assistance fell 23.1% in real terms that year. That is the largest single-year contraction in the history of foreign aid.
At the same time, only 16% of all SDG targets are projected to be met by 2030. SDG 17 exists to fund and coordinate progress on the other 16 goals. Right now, that funding is shrinking.
Debt is rising as aid falls. Developing countries paid $741 billion more in debt service than they received in new financing between 2022 and 2024.
This guide covers what SDG 17 actually asks of the world. It shows where 2026 progress stands, country by country. It also covers what businesses can do about it.
What is SDG 17
SDG 17 aims to “strengthen the means of implementation and revitalize the global partnership for sustainable development.” It is the seventeenth Sustainable Development Goal. It is also the final one.
All 193 UN member states adopted it in 2015, as part of the 2030 Agenda.
Unlike most SDGs, this one is not about a single sector. It is the funding and coordination layer beneath all 16 other goals.
The goal has 19 targets, grouped into five clusters. They cover finance, technology, capacity-building, trade, and systemic issues like data and policy coherence.
A country can meet its own domestic goals and still under-fund global partnerships. It can pledge aid and still fail to deliver it. SDG 17 tracks each piece on its own.
The official targets and indicators behind SDG 17
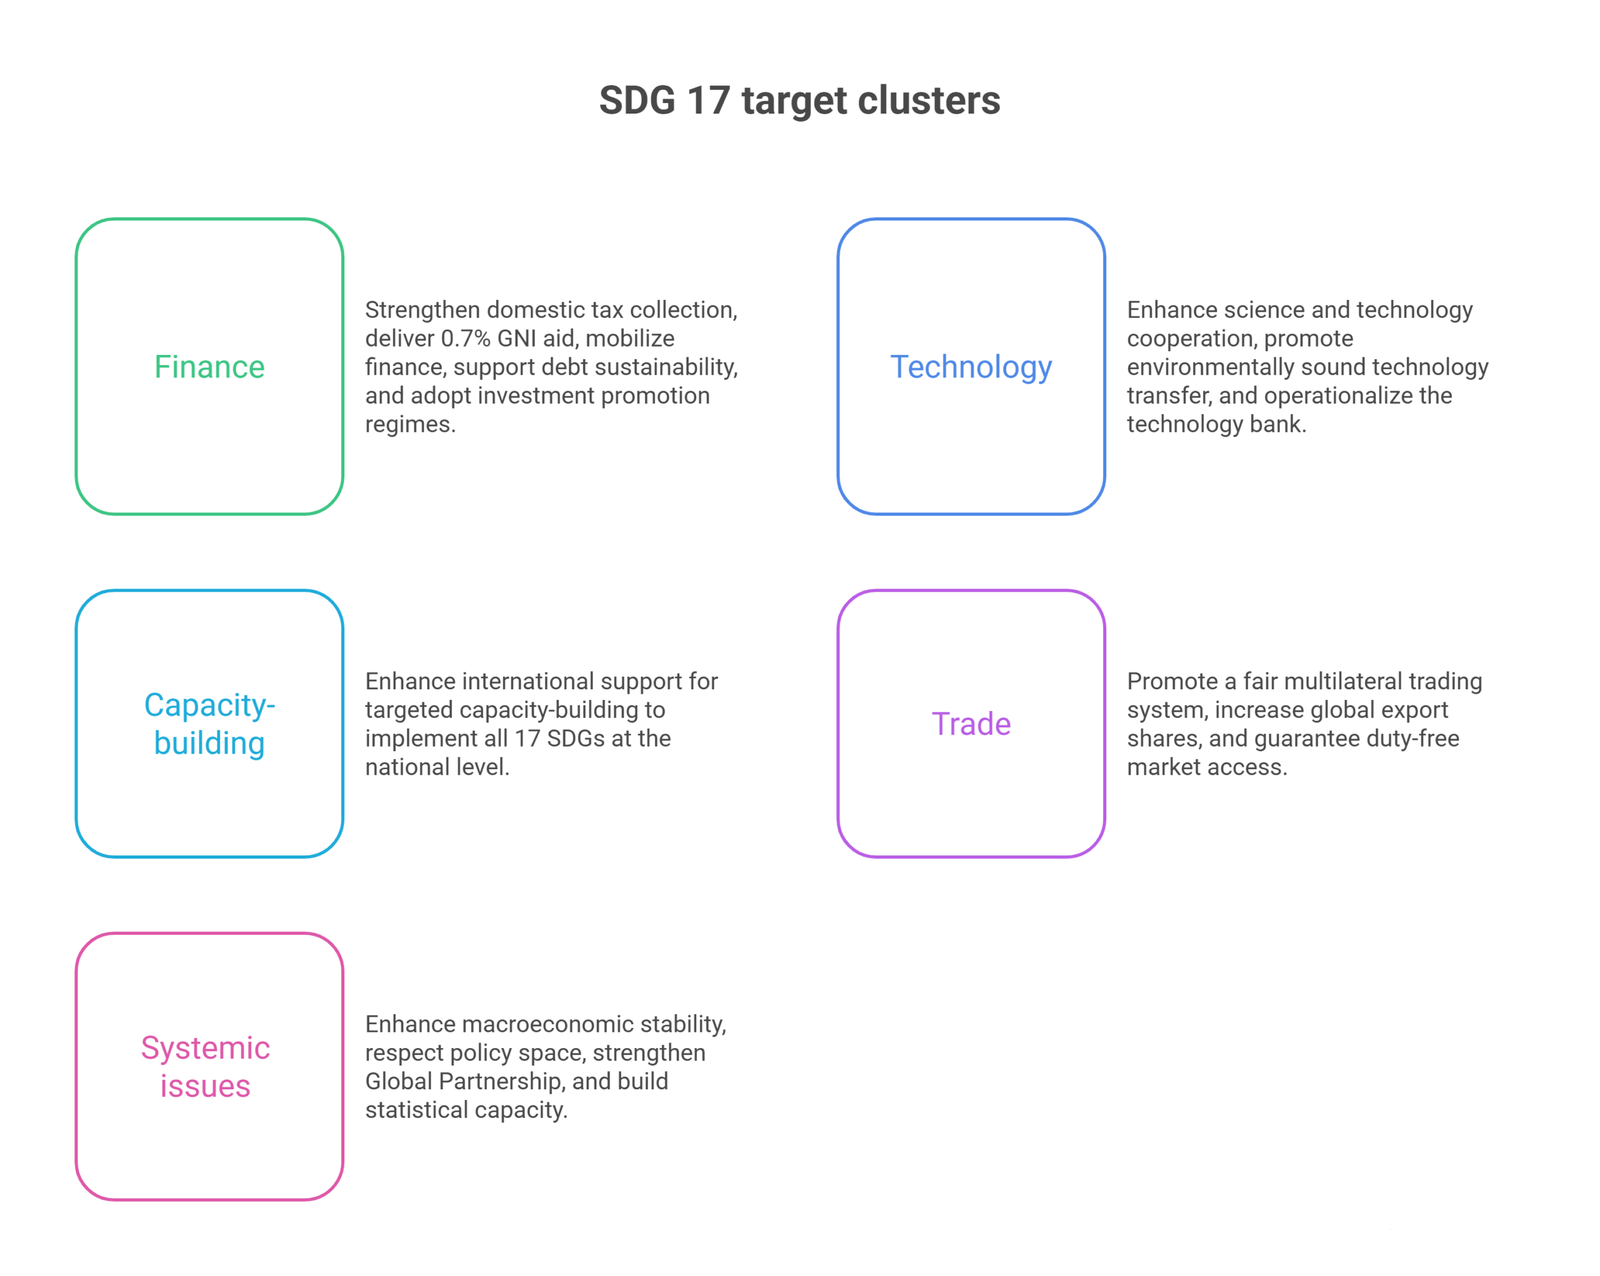
SDG 17 breaks into five clusters of targets, according to the UN’s SDG 17 page.
Finance (17.1-17.5): Strengthen domestic tax collection. Deliver on the 0.7% of GNI aid commitment. Mobilize additional finance for developing countries. Support debt sustainability and relief. Adopt investment promotion regimes for least developed countries.
Technology (17.6-17.8): Enhance North-South and South-South cooperation on science and technology. Promote transfer of environmentally sound technologies. Fully operationalize the technology bank for least developed countries.
Capacity-building (17.9): Enhance international support for targeted capacity-building, so developing countries can implement all 17 SDGs at the national level.
Trade (17.10-17.12): Promote a fair, rules-based multilateral trading system. Increase developing countries’ share of global exports. Guarantee duty-free, quota-free market access for least developed countries.
Systemic issues (17.13-17.19): Enhance macroeconomic stability and policy coherence. Respect national policy space. Strengthen the Global Partnership for Sustainable Development. Build statistical capacity, disaggregated data, and country-owned results frameworks worldwide.
Where global progress actually stands
The data comes from the 2026 Extended Report on SDG 17, compiled by OECD, UNCTAD, the World Bank, and ITU.
Foreign aid just posted its worst year on record. DAC donor countries gave $174.3 billion in 2025, a 23.1% real-terms drop. That reverses a decade of gradual growth in a single year.
The cut was concentrated among the five largest donors. France, Germany, Japan, the UK, and the US together drove 95.7% of the global fall. The US alone caused three-quarters of it, cutting its own aid by 56.9%.
Only four countries still meet the UN’s 0.7%-of-GNI aid target. Norway leads at 1.03%, followed by Luxembourg, Sweden, and Denmark.
Development finance from all sources held up better than aid alone. Total resources mobilized for developing countries reached $419.6 billion in 2024, up 12% from the year before.
Remittances kept growing, unlike aid. Flows to low- and middle-income countries hit $687 billion in 2024, up nearly 10%. India, Mexico, the Philippines, Pakistan, and China received the most.
Debt costs kept climbing. Developing countries’ interest payments hit a record $415.4 billion in 2024. Total external debt across low- and middle-income countries reached $8.9 trillion.
Digital access kept expanding, unevenly. 74% of the world was online in 2025, up from 40% a decade earlier. In the least developed countries, only 34% had internet access.
Statistical capacity crossed a milestone. The global data-availability score passed 50 out of 100 for the first time in 2024. Health data systems remain fragile.
The table below summarizes where the core SDG 17 indicators stood in the latest reporting.
| Indicator | Latest figure |
| Global official development assistance | $174.3 billion (2025), down 23.1% |
| Countries meeting the 0.7%-of-GNI aid target | 4 of 34 DAC members |
| Total development finance mobilized (TOSSD) | $419.6 billion (2024), up 12% |
| Remittances to low- and middle-income countries | $687 billion (2024), up nearly 10% |
| Developing countries’ interest payments on external debt | $415.4 billion (2024), a record high |
| Global population using the internet | 74% (2025), up from 40% in 2015 |
| SDG targets projected to be met by 2030 | 16% |
Source: OECD, UNCTAD, World Bank, and ITU, via the 2026 Extended Report on SDG 17.
Countries ranked: from most committed to least committed
Aid generosity is the clearest, most comparable measure of a country’s commitment to SDG 17. It is tracked the same way across every donor nation.
Only four DAC countries hit the UN’s target of giving 0.7% of national income as aid. The global DAC average sits at just 0.26%, well below that mark.
Non-DAC donors are tracked separately, but still measured the same way. The UAE gave 0.61% of its GNI as aid in 2025, ranking third among non-DAC providers worldwide.
A separate measure captures something broader. The Sustainable Development Report 2026 ranks countries on support for UN-based multilateralism itself, not just aid volume. Barbados ranks first. The United States ranks last.
| Rank | Country | ODA as a share of GNI (2025) |
| 1 | Norway | 1.03% |
| 2 | Luxembourg | 0.99% |
| 3 | Sweden | 0.85% |
| 4 | Denmark | 0.72% |
| — | UAE (non-DAC) | 0.61% |
| 5 | Netherlands | Above the DAC average, below the UN target |
| 6 | Germany | Above the DAC average, largest DAC donor by volume |
| 7 | Switzerland | Above the DAC average |
| 8 | Finland | Above the DAC average |
| 9 | United Kingdom | Above the DAC average |
| 10 | Ireland | Above the DAC average |
| 11 | France | Above the DAC average |
| 12 | Belgium | Above the DAC average |
| 13 | Japan | 0.35% |
| — | DAC average | 0.26% |
| — | United States | Cut by 56.9% in 2025, historically among the lowest ratios |
Norway

Norway shows what sustained aid commitment looks like, even in a volatile year.
It gave 1.03% of its gross national income as foreign aid in 2025. That is the highest ratio of any DAC donor country.
Norway held that commitment steady while most large donors cut sharply. Three other countries, Luxembourg, Sweden, and Denmark, also stayed above the UN’s 0.7% target.
Norway’s case backs a clear point. Meeting the aid target is a matter of sustained political choice, not just national wealth.
UAE
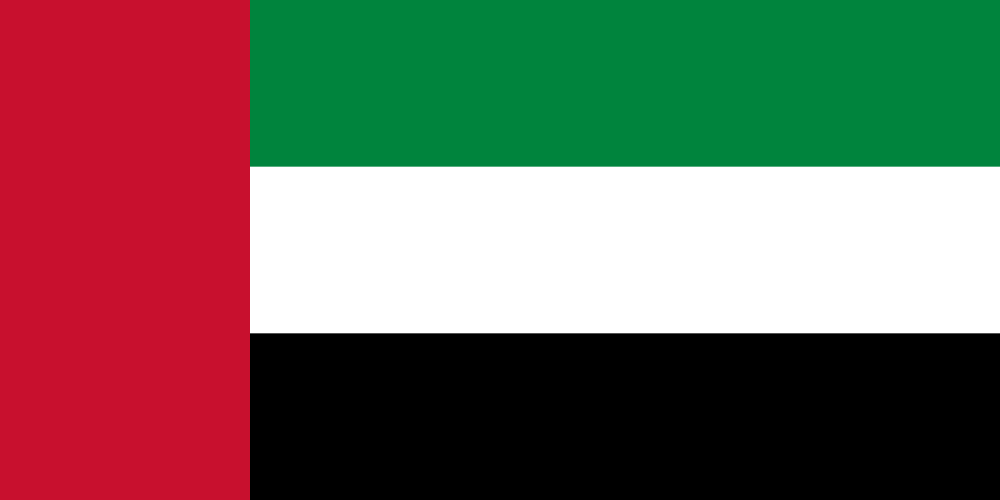
The UAE is not a DAC member, so the OECD tracks it separately from countries like Norway or the US.
By its own numbers, the UAE gave 0.61% of GNI as aid in 2025, or $3.4 billion. That is a 55.5% real-terms increase over the year before.
Among non-DAC donors, only two countries gave a higher share of national income. Most of the UAE’s aid reaches countries facing high or extreme fragility.
The UAE’s case shows that strong aid performance is not limited to traditional Western donors. Its ratio would rank among the world’s top five if measured on the same DAC scale.
United States

The United States drove most of the global aid collapse in 2025, cutting its own contribution by 56.9%.
That single cut accounted for three-quarters of the entire worldwide decline. It also ended a decade in which the US was consistently the largest DAC donor.
Germany became the largest DAC provider for the first time in 2025, at $29.1 billion. The US followed closely at $29.0 billion, a near-tie that reflects just how far US aid fell.
The US also ranks last on the Sustainable Development Report’s UN-Mi Index of multilateralism support. It withdrew from more than 60 international organizations in January 2026 alone.
The US case shows how quickly one country’s policy shift can reshape a global indicator. No other single country moved SDG 17’s numbers as much in 2025.
The financing paradox: aid falls just as debt costs rise
Two trends moved in opposite directions in 2025, and both make the other worse.
Global aid posted its steepest drop on record. In the same period, developing countries paid a record $415.4 billion in debt interest.
Between 2022 and 2024, developing countries paid $741 billion more in debt service than they received in new financing. That is the largest such gap in at least 50 years.
Falling aid does not just mean less money for programs. It also removes financing developing countries could otherwise use to avoid new borrowing altogether.
The result compounds over time. Countries facing debt distress have less room to invest in health data and statistical capacity. Those are the very areas SDG 17 is meant to strengthen.
What organizations and institutions are doing
Several international bodies coordinate SDG 17 monitoring and financing. There is no single global fund.
Organisation for Economic Co-operation and Development
The OECD tracks official development assistance through its Development Assistance Committee. Its annual DAC statistics anchor most global aid reporting.
UN Conference on Trade and Development
UNCTAD co-leads data on development finance, debt, and South-South cooperation. It also tracks developing countries’ share of global exports and trade access.
World Bank
The World Bank tracks external debt statistics for low- and middle-income countries. Its International Debt Report is the primary source on developing-country debt distress.
International Telecommunication Union
The ITU tracks internet access, broadband penetration, and the digital divide. Its annual Facts and Figures report anchors most global connectivity data.
How businesses can contribute to SDG 17
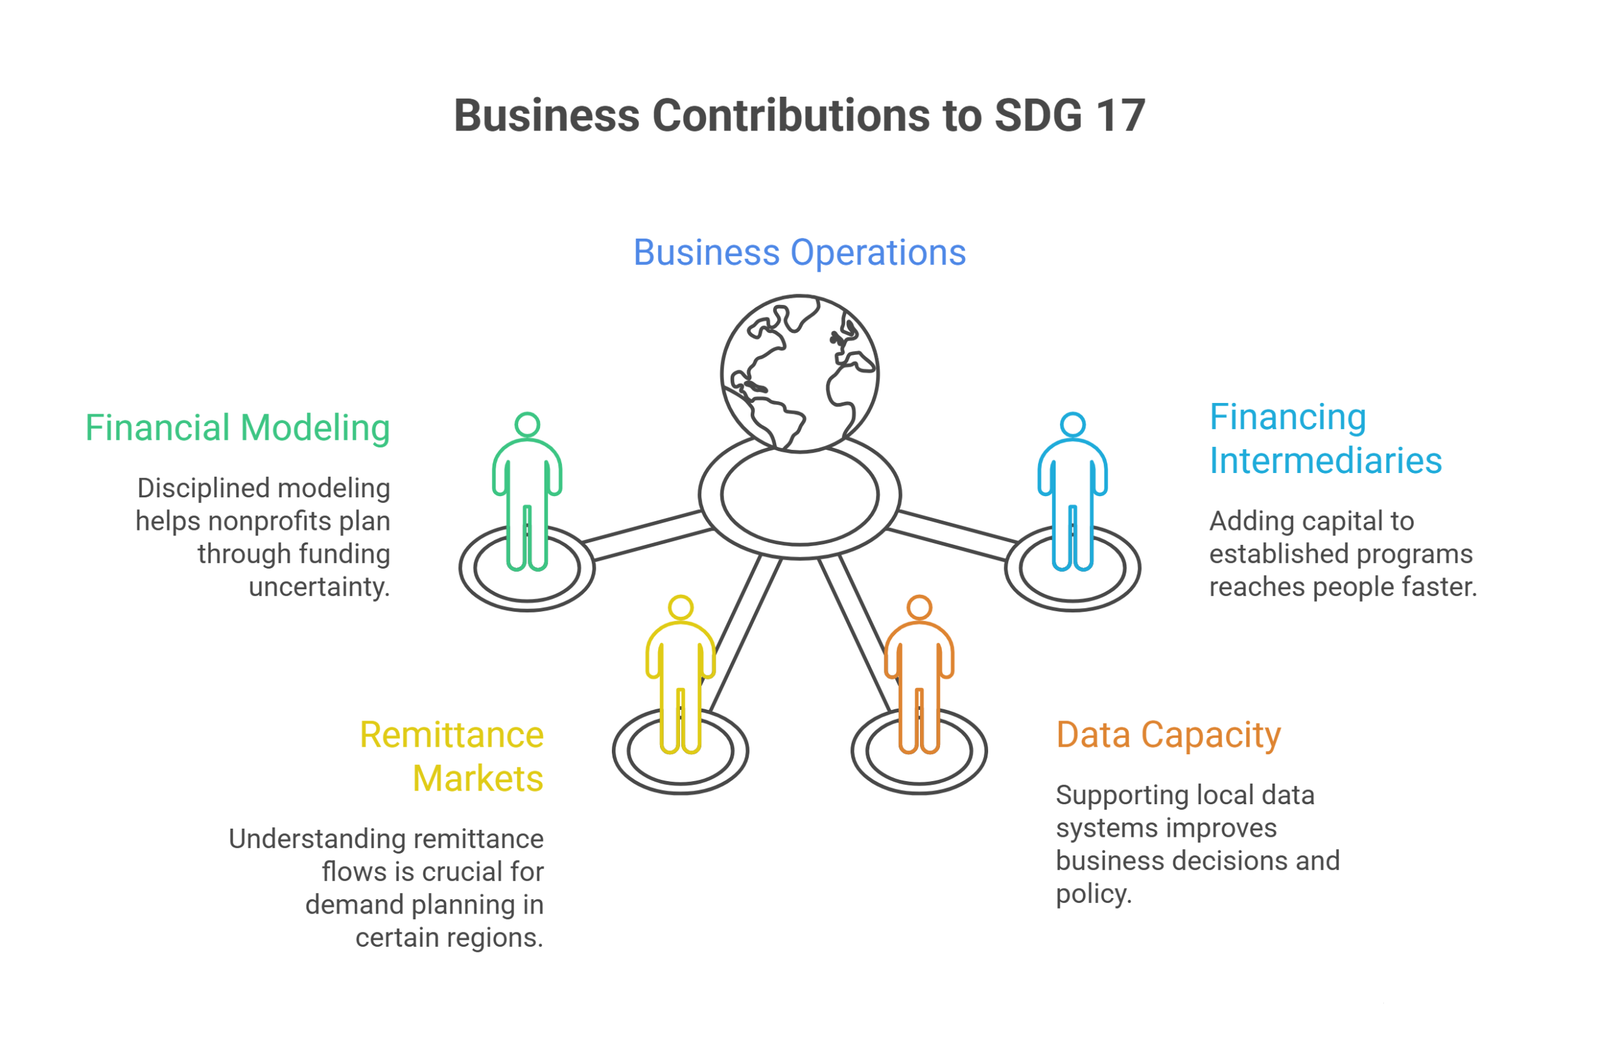
The same approach applies here as with any SDG a company has no formal mandate on. Start with where operations touch global finance and partnerships. Then look outward from there.
Model nonprofit and NGO finances with real rigor
Falling aid means every remaining dollar needs to work harder. A nonprofit financial modeling case study shows how disciplined modeling helps organizations plan through funding uncertainty. A well-structured nonprofit business plan matters even more when donor funding is shrinking.
Understand remittance-dependent markets before entering them
Businesses expanding into South Asia, Latin America, or the Philippines should factor remittance flows into demand planning. These flows now dwarf aid in scale.
Support statistical and data capacity where you operate
Reliable local data drives better business decisions, not just better policy. Companies operating in developing markets have a direct interest in stronger national data systems.
Back financing intermediaries instead of building parallel infrastructure
OECD, UNCTAD, and the World Bank already coordinate financing and debt relief channels. Adding capital to an established program usually reaches people faster.
Frequently Asked Questions
How many SDG 17 targets and indicators are there?
19 targets across five clusters: finance, technology, capacity-building, trade, and systemic issues like data and policy coherence.
Is the world on track to meet SDG 17 by 2030?
No. Only 16% of all SDG targets are projected to be met. Foreign aid just posted its steepest decline on record.
Which countries are most committed to foreign aid?
Norway, Luxembourg, Sweden, and Denmark are the only DAC donors still meeting the UN’s 0.7%-of-GNI aid target.
Why did US foreign aid fall so sharply in 2025?
A 56.9% cut in US aid drove three-quarters of the entire global decline. That ended a decade as the world’s largest DAC donor.
How does the aid decline connect to developing-country debt?
Aid fell just as debt interest payments hit a record high. Developing countries are paying far more in debt service than they receive in new financing.
Can a business without a development mandate still contribute to SDG 17?
Yes. The clearest levers are modeling nonprofit finances rigorously, understanding remittance-driven markets, and supporting local statistical capacity.
Conclusion
The number worth sitting with is not the 74% of the world now online. That gain, after all, is real. The more telling number is that global aid just posted its steepest one-year drop in history.
Norway shows what sustained commitment looks like, even as other donors retreat. The United States shows how fast one country’s policy shift can reshape a global goal. Debt and aid are now moving in opposite directions at once.
None of that gets solved by declarations alone. It gets solved by financing that is modeled honestly and partnerships that hold up when conditions get harder.
Building a financial model for a nonprofit, NGO, or cross-border venture? Oak’s financial modeling services can help. Oak builds the numbers behind the partnership.