10 SaaS Financial Metrics Every Business Needs to Track
10 SaaS financial metrics that tell you if you’re actually growing
Most SaaS founders can rattle off their MRR without checking a dashboard. Fewer can say what their net revenue retention was last quarter, or whether their CAC payback period is getting better or worse. That gap is usually what separates a company that raises its next round from one that stalls out at the same ARR for two years straight.
There are dozens of SaaS KPIs floating around Twitter threads and pitch deck templates. Not all of them matter equally, and tracking too many at once just creates noise. The ten below are the ones investors, boards, and finance teams actually check first, along with the formulas and the benchmarks that separate a healthy SaaS business from one that’s quietly in trouble.
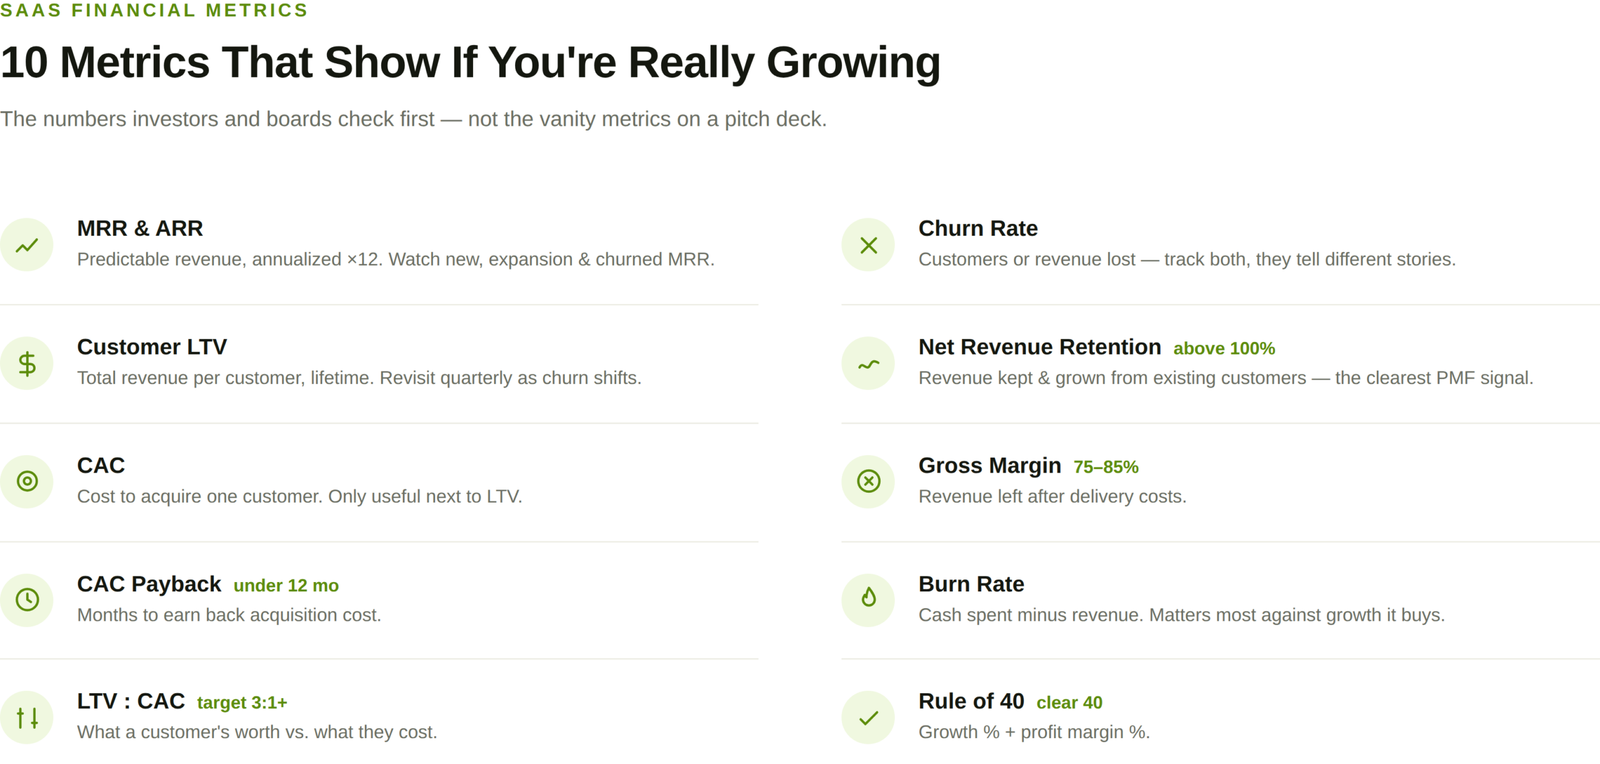
1. Monthly and annual recurring revenue (MRR and ARR)
MRR is the predictable subscription income a company collects each month from active paying customers. ARR is the same figure annualized, and it’s what most investors use when they talk about a company’s size.
Formula: MRR = Number of paying customers × average revenue per user (ARPU) ARR = MRR × 12
If a company has 500 subscribers paying $100 a month, MRR is $50,000 and ARR is $600,000.
MRR only tells the full story once it’s broken into its components: new MRR from fresh signups, expansion MRR from upgrades, and churned MRR from cancellations or downgrades. A company can show flat total MRR while masking a customer base that’s quietly shrinking underneath it, so it’s worth tracking the pieces, not just the headline number.
2. Customer lifetime value (LTV)
LTV estimates the total revenue a single customer generates over the entire time they stay subscribed. It’s the number that tells a company whether its acquisition spend is actually paying off.
Formula: LTV = ARPU × Gross margin ÷ Churn rate
If ARPU is $150 a month, gross margin is 80%, and monthly churn is 2%, LTV works out to $6,000.
LTV is only as accurate as the churn assumption behind it, and churn tends to shift with a company’s size and market, so this number should get revisited quarterly rather than calculated once and forgotten. Early-stage companies without much churn history yet often build this into a startup financial model as a working assumption, then update it as real data comes in.
3. Customer acquisition cost (CAC)
CAC is the total cost of acquiring one new paying customer, covering sales salaries, commissions, ad spend, and marketing tools.
Formula: CAC = Total sales and marketing expenses ÷ number of new customers acquired
If a company spends $20,000 on marketing in a month and closes 200 new customers, CAC is $100.
CAC on its own doesn’t mean much. It only becomes useful next to LTV, which is why the ratio below matters more than either number in isolation.
4. CAC payback period
This is how many months it takes to earn back what was spent to acquire a customer, based on the gross margin that customer generates each month.
Formula: CAC payback period = CAC ÷ (MRR per customer × gross margin)
If CAC is $1,200, a customer’s MRR is $200, and gross margin is 80%, payback takes 7.5 months.
Anything under 12 months is generally considered healthy for a subscription business, since it means the company can reinvest that cash into acquiring the next customer within a year rather than waiting years to see a return.
5. LTV to CAC ratio
This ratio compares how much a customer is worth against what it costs to acquire them, and it’s usually the single number an investor asks for first.
Formula: LTV : CAC = Customer lifetime value ÷ customer acquisition cost
If LTV is $6,000 and CAC is $2,000, the ratio is 3:1.
A ratio below 1:1 means the company is losing money on every customer it signs. Most investors look for at least 3:1 before they consider a SaaS company’s growth engine sustainable, and ratios well above that (5:1 or higher) can sometimes suggest a company is being too conservative with its marketing spend rather than pushing for faster growth.
6. Churn rate
Churn measures how many customers, or how much revenue, a company loses in a given period. It comes in two flavors that tell different stories.
Formula (customer churn): Churn rate = Customers lost ÷ customers at the start of the period × 100 Formula (revenue churn): Revenue churn = (Starting MRR − ending MRR from existing customers) ÷ starting MRR × 100
If a company starts the month with 1,000 customers and loses 25, customer churn is 2.5%.
Customer churn and revenue churn can tell opposite stories. A company might lose several small customers (high customer churn) while its biggest accounts expand and offset the loss (low revenue churn), or the reverse: losing one enterprise account while customer counts look stable. Track both, not just one.
7. Net revenue retention (NRR)
NRR measures how much recurring revenue a company keeps and grows from its existing customer base, after accounting for churn, downgrades, and expansion from upsells.
Formula: NRR = (Starting MRR + expansion − churn − downgrades) ÷ starting MRR × 100
If a company starts the quarter with $100,000 in MRR, adds $25,000 in expansion, and loses $5,000 to churn and downgrades, NRR is 120%.
NRR above 100% means the existing customer base is growing revenue on its own, even before a single new customer is signed. That’s the single clearest signal of product-market fit a SaaS company can point to, which is why it shows up in nearly every board deck and every diligence checklist a growth-stage investor runs. NRR below 100% means the business is running to stand still: new sales are just replacing what’s leaking out the bottom.
A related figure, gross revenue retention (GRR), measures the same thing but excludes expansion revenue, capping the result at 100%. GRR strips out the upsell effect and shows how much revenue would remain if a company never sold another upgrade, which makes it a cleaner read on how sticky the core product actually is.
8. Gross margin
Gross margin is the percentage of revenue left after subtracting the direct cost of delivering the product, including hosting, infrastructure, and customer support.
Formula: Gross margin = (Revenue − cost of goods sold) ÷ revenue × 100
If monthly revenue is $100,000 and cost of goods sold is $20,000, gross margin is 80%.
Most healthy SaaS companies run gross margins between 75% and 85%. A margin that’s drifting down usually points to rising support or hosting costs that pricing hasn’t kept up with.
9. Burn rate
Burn rate is how quickly a company is spending its cash reserves, usually tracked monthly. It’s the metric that answers the blunt question every founder eventually has to face: how many months of runway are left.
Formula: Burn rate = Total monthly expenses − total monthly revenue
A company spending $150,000 a month while bringing in $100,000 in revenue has a burn rate of $50,000, and with $600,000 in the bank, that’s 12 months of runway.
Burn rate matters less on its own and more against what it’s buying. A high burn rate paired with fast, efficient new-customer growth is a very different story than the same burn rate with flat MRR.
10. Rule of 40
Rule of 40 combines growth and profitability into one number, and it’s become the shorthand investors use to judge whether a SaaS company’s growth is actually sustainable or just expensive.
Formula: Rule of 40 = Revenue growth rate (%) + profit margin (%)
A company growing revenue 30% a year with a 10% profit margin scores 40, which clears the bar. A company growing 75% while burning cash at negative 50% profitability only scores 25, despite the flashier growth number.
There’s no fixed formula for what “profit margin” should mean here. Some companies use EBITDA margin, others use free cash flow margin. Whichever is used, the point of Rule of 40 is to stop a founder from hiding a profitability problem behind an impressive growth chart, or vice versa.
Where these numbers should land
| Metric | Healthy benchmark |
| Gross margin | 75% or higher |
| CAC payback period | Under 12 months |
| LTV : CAC ratio | 3:1 or higher |
| Net revenue retention | Above 100% |
| Monthly churn rate | Under 5% annualized |
| Rule of 40 | 40 or higher |
These are general benchmarks, not hard rules. An early-stage startup burning cash to grow fast can look “unhealthy” on Rule of 40 while still being exactly where it should be for its stage. Benchmarks are a starting point for a conversation with a financial analyst, not a substitute for one.
Bookings, billings, and revenue aren’t the same thing
These three terms get used interchangeably, which causes real confusion when a board asks why “revenue” doesn’t match what sales just closed.
- Bookings is the total contract value a customer commits to when they sign, recorded on the signing date.
- Billings is what actually gets invoiced, recorded when the invoice goes out.
- Revenue is what gets recognized as the service is delivered, month by month, under ASC 606 rules.
A $120,000 annual contract signed today is booked in full immediately, might be billed upfront or quarterly depending on the terms, and gets recognized as $10,000 of revenue each month for the next year. Mixing these up is one of the more common reasons SaaS financial statements confuse first-time founders and even some investors.
Frequently Asked Questions
Which SaaS financial metric matters most?
There isn’t one universal answer, but net revenue retention is usually the metric investors look at first because it shows whether the existing customer base is growing on its own.
How often should a SaaS company track these metrics?
Monthly at minimum. Fast-growing companies with more transaction volume often track MRR, CAC, and churn weekly, or in real time through a dashboard.
What’s a good churn rate for a SaaS company?
Under 5% annually is a common target for B2B SaaS, though this varies a lot by customer segment. Enterprise SaaS companies often see much lower churn than products sold to small businesses.
Is a high CAC always a bad sign?
Not necessarily. A high CAC paired with a high LTV and fast payback period can still be a healthy, profitable model. The problem is a high CAC with a low LTV:CAC ratio or a payback period stretching past 12 months.
What’s the difference between NRR and GRR?
NRR includes expansion revenue from upsells and can exceed 100%. GRR excludes expansion and is capped at 100%, making it a cleaner measure of how sticky the core product is on its own.
Do these metrics apply to early-stage startups with few customers?
Yes, though small sample sizes make some ratios noisy. A startup with 10 customers shouldn’t panic over one lost account moving churn from 0% to 10% in a single month. The trend over several quarters matters more than any single data point.
Conclusion
Tracking ten metrics doesn’t fix a broken SaaS business on its own, but it does mean problems show up on a dashboard months before they show up in a bank balance. The founders who get blindsided are usually the ones who were only watching MRR and never checked what was happening underneath it.
For SaaS companies that want these metrics built into an actual financial model rather than tracked in a spreadsheet that falls out of date, Oak’s SaaS financial model services build MRR, churn, CAC, and NRR tracking directly into forecasts and investor-ready reporting. Oak’s CFO services for SaaS companies go a step further, pairing that reporting with ongoing guidance on where the numbers should be heading next.