Financial Analysis Techniques – The Complete List of 5 Techniques
Financial analysis techniques: the complete guide for growing businesses
A founder who can recite last quarter’s revenue number but cannot explain why gross margin dropped three points is not doing financial analysis. They are reading a scoreboard without understanding the game. Financial analysis is what turns a stack of statements into an answer to the question that actually matters: is this business getting healthier or sicker, and what should be done about it?
This guide walks through the core financial analysis techniques every business owner should know, shows the exact ratios and formulas behind them, applies them across five industries where the numbers behave differently, and adds a section most guides skip entirely: the techniques that matter specifically for startups still figuring out whether they will survive the next eighteen months.
What is financial analysis, and why does it matter more than most owners think?
Financial analysis is the process of examining a company’s financial statements, meaning the balance sheet, income statement, and cash flow statement, to understand how the business is really performing and to guide decisions about strategy, investment, and risk. It converts raw numbers into a narrative: where the business has been, where it stands now, and where it is likely headed if nothing changes.
The reason it matters goes beyond compliance or investor reporting. Financial analysis is diagnostic. It surfaces a shrinking margin months before it becomes a cash crisis. Additionally, it shows whether a growth spurt is genuinely profitable or simply expensive. It flags when a company is quietly becoming over-leveraged long before a lender does. Business owners who treat financial analysis as an annual exercise for the accountant are missing most of its value; it is most useful as a running habit, reviewed monthly or quarterly, not as an autopsy performed once a year.
The core financial analysis techniques
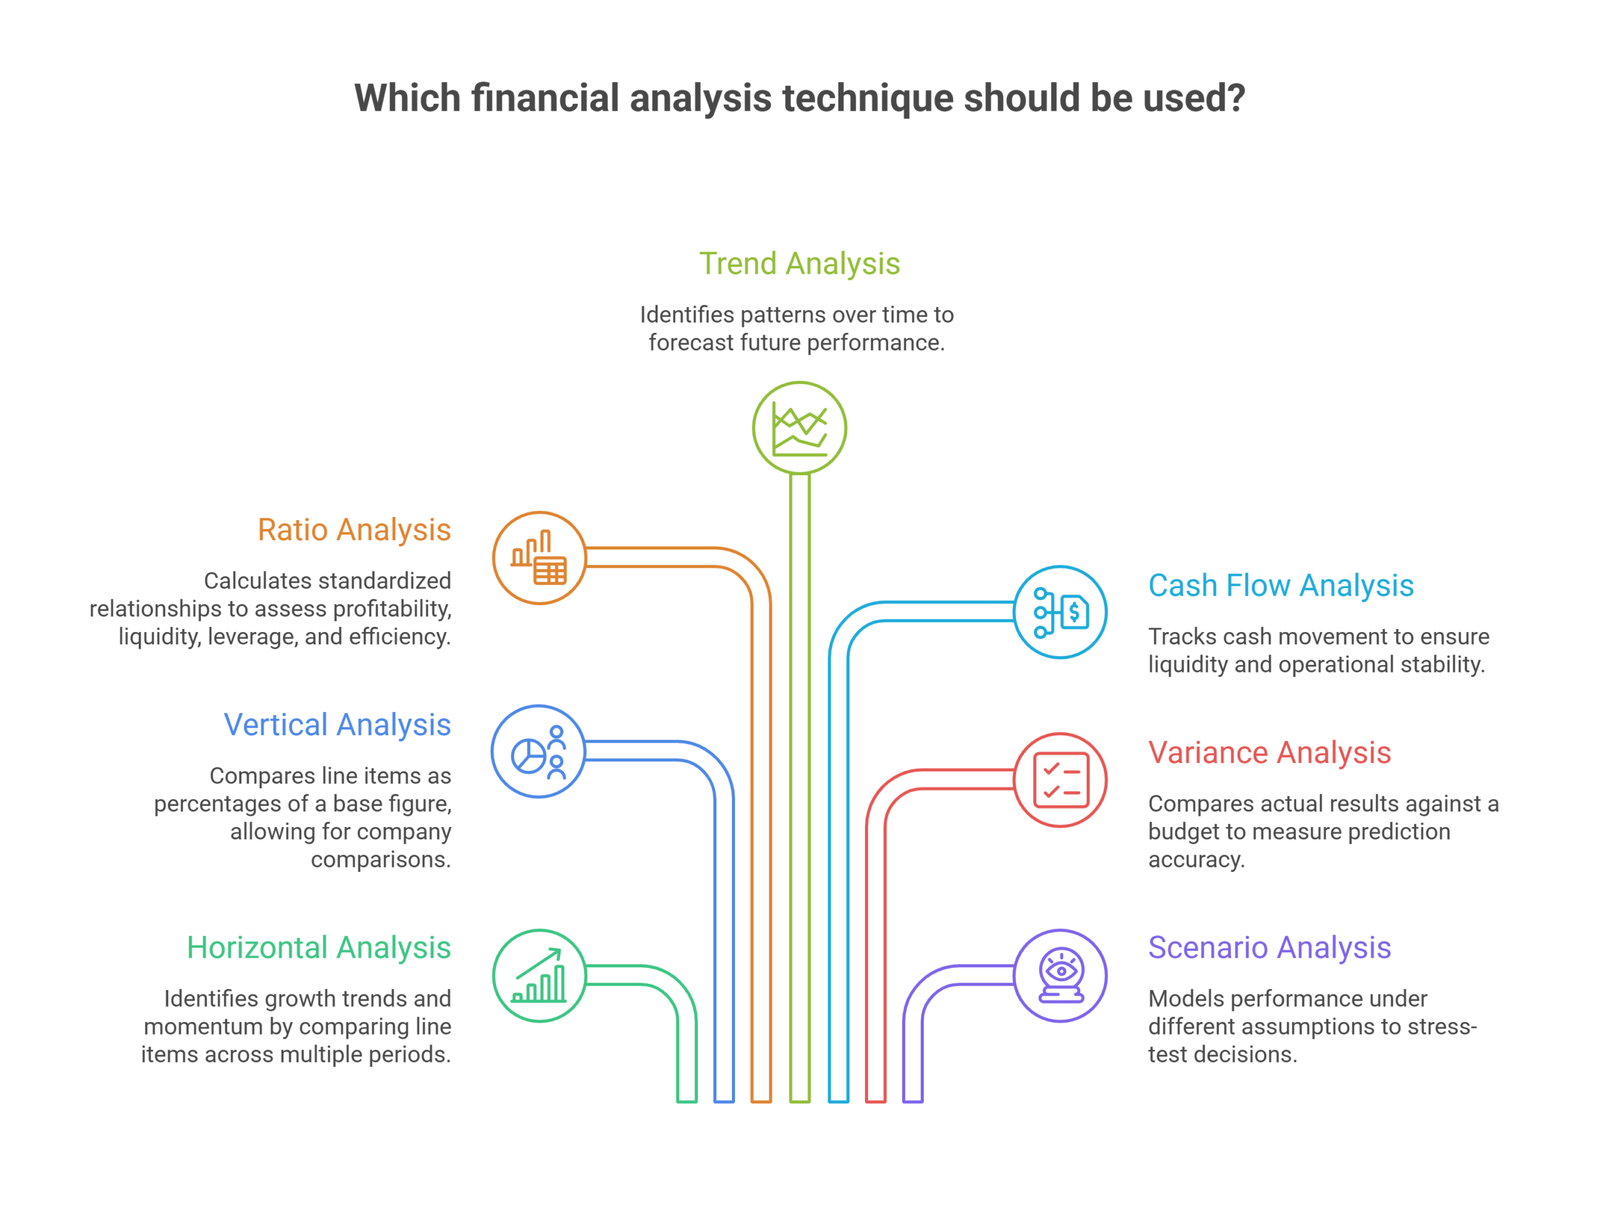
Most financial analysis techniques fall into one of the following categories. Understanding what each one actually measures, rather than treating them as interchangeable, is what separates a useful analysis from a box-checking exercise.
Horizontal analysis compares the same line item across multiple periods, typically three to five years, to reveal growth trends and momentum. If revenue is rising 8% a year but operating costs are rising 12% a year, horizontal analysis is what catches it, long before a single year’s numbers would look alarming on their own.
Vertical analysis expresses each line item as a percentage of a base figure: revenue for the income statement, total assets for the balance sheet. It is often called common-size analysis because it lets you compare a small company to a much larger one, or your own numbers this year against last year, on equal footing. If cost of goods sold quietly climbs from 55% of revenue to 62% over two years, vertical analysis is where that shows up clearly.
Ratio analysis calculates standardized relationships between financial figures, such as current assets to current liabilities, to assess profitability, liquidity, leverage, and efficiency. This is the most widely used technique because ratios are comparable across time periods, across companies, and against industry benchmarks. The ratio tables below cover the ones that matter most.
Trend analysis looks at data over time to identify patterns, whether that is customer demand, a specific cost category, or an operational metric, and uses those patterns to forecast what is likely next.
Cash flow analysis tracks how cash actually moves through the business across operating, investing, and financing activities. This is arguably the single most important technique for small and mid-sized businesses, because a company can report a healthy profit on paper while running out of the cash to make payroll. Profit is an opinion; cash is a fact.
Variance analysis compares actual results against a budget or forecast to measure how accurately the business predicted its own performance, and where the gap came from.
Scenario and sensitivity analysis models how the business would perform under different assumptions, such as a 15% drop in demand or a supply cost increase, and is especially valuable for stress-testing decisions before committing capital.
Financial ratios, organized by what they actually tell you
Ratios are only useful when read in the right order and compared against a benchmark, whether that benchmark is the company’s own prior year or an industry peer. A ratio in isolation is a number without context.
Liquidity ratios: can the business meet its near-term obligations?
| Ratio | Formula | What it measures |
| Current ratio | Current assets ÷ current liabilities | Ability to cover short-term liabilities with short-term assets |
| Quick ratio | (Current assets − inventory) ÷ current liabilities | Liquidity excluding inventory, a stricter test |
| Cash ratio | Cash and equivalents ÷ current liabilities | The most conservative liquidity measure |
Profitability ratios: is the business generating adequate returns?
| Ratio | Formula | What it measures |
| Gross profit margin | (Revenue − COGS) ÷ revenue | Revenue retained after direct production costs |
| Operating margin | Operating income ÷ revenue | Profitability from core operations, before interest and tax |
| Net profit margin | Net profit ÷ revenue | Profitability after every expense is accounted for |
| Return on equity | Net income ÷ shareholders’ equity | How effectively shareholder capital generates profit |
Leverage ratios: how much of the business is financed by debt?
| Ratio | Formula | What it measures |
| Debt-to-equity ratio | Total liabilities ÷ shareholders’ equity | Reliance on debt relative to owner capital |
| Interest coverage ratio | EBIT ÷ interest expense | Ability to cover interest payments from operating earnings |
Efficiency ratios: how well are resources being converted into revenue?
| Ratio | Formula | What it measures |
| Inventory turnover | COGS ÷ average inventory | Speed of inventory sell-through |
| Accounts receivable turnover | Net credit sales ÷ average receivables | Speed of customer payment collection |
| Asset turnover | Revenue ÷ total assets | Revenue generated per dollar of assets |
A single ratio rarely tells the whole story. A high current ratio paired with a very low quick ratio usually means too much cash is trapped in inventory. A rising return on equity paired with rising debt-to-equity can mean the return is coming from leverage rather than genuine operational improvement, not from the business getting better at what it does. Read ratios in pairs, and always against the trend, not just the current value.
Financial analysis techniques by industry
The techniques above are universal, but which ones matter most, and how they should be interpreted, shifts by industry. A current ratio that looks alarming for a software company might be entirely normal for a grocery retailer.
Retail
Retailers live and die on inventory efficiency and margin discipline. Ratio analysis, specifically gross margin, inventory turnover, and days sales outstanding, is the daily language of retail financial health. A steadily declining gross margin usually signals either pricing pressure or a need for tighter cost control before it shows up as a cash problem. Cash flow forecasting matters enormously here too, since retailers often carry seasonal inventory buildup that has to be financed months before it converts to revenue. Budgeting, meaning setting concrete spending limits by category and tracking actual against planned, is what keeps that seasonal swing from becoming a liquidity crunch.
Real estate
Real estate financial analysis blends cash flow projection with return analysis and risk assessment, since a property’s value depends as much on projected income as on current market comparables. Investors typically layer ratio analysis (debt-to-equity, debt service coverage) with horizontal analysis (how has this asset class performed over multiple years) and vertical analysis (how does this specific property’s cost structure compare to similar assets) before committing capital. Because real estate is capital-intensive and illiquid, the cost of an analysis mistake is higher than in most industries, which is exactly why professional financial modeling support tends to pay for itself on a single deal.
Healthcare
Healthcare organizations rely heavily on trend analysis and benchmarking. Trend analysis tracks patient outcomes, utilization rates, and cost per encounter over time to catch quality or cost issues before they compound. Benchmarking compares a facility’s performance against similar organizations, whether through public data or industry surveys, to identify where costs are out of line or where care quality lags peers. The two techniques work together: trend analysis shows direction, benchmarking shows relative position.
Automotive
The automotive industry has long depended on trend analysis to anticipate shifting consumer demand well before it shows up in sales figures. Two well-known examples illustrate this well. In the 1980s, Toyota used demand trend data to recognize a shift toward smaller, more fuel-efficient vehicles years before General Motors adjusted its own product mix, and that early read on the trend was a meaningful factor in Toyota’s later rise to the industry’s top position. More recently, Tesla’s early bet on electric vehicles was informed by tracking adoption trends in battery technology and consumer sentiment well ahead of the rest of the industry, a bet that helped the company grow from a niche manufacturer into one of the most valuable automakers in the world. Cost management analysis and cash flow analysis remain equally essential day to day, since automotive manufacturing carries high fixed costs and long production cycles that punish poor cash planning quickly.
Education
Educational institutions increasingly rely on financial analysis for strategic planning and long-range forecasting, since enrollment and funding cycles move slowly and mistakes are expensive to reverse. Forecasting future enrollment and revenue helps administrators build budgets that hold up against a bad semester rather than assuming steady growth. Asset management, meaning tracking how facilities, technology, and staffing resources are deployed relative to enrollment and research activity, is where many institutions find the easiest efficiency gains without touching program quality.
Financial analysis techniques every startup needs, that most guides skip
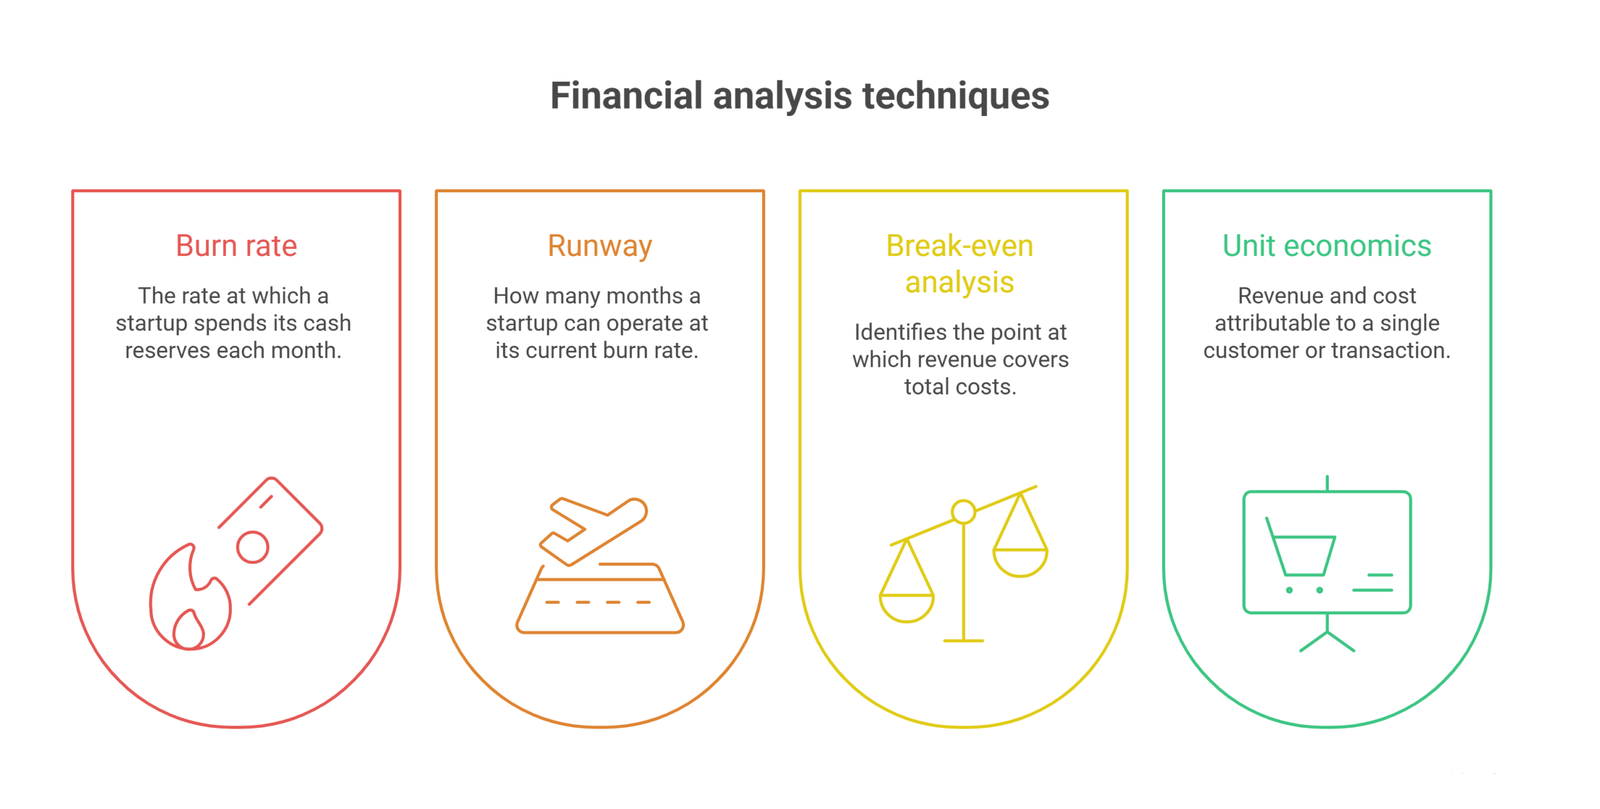
Startups face a different set of questions than established businesses, because the goal often is not profitability yet, it is survival long enough to reach the next milestone.
Burn rate is the rate at which a startup spends its cash reserves each month, typically calculated as net cash used in operations over a given period. It is the single most-watched number for an early-stage company, because it directly determines runway.
Runway is how many months a startup can continue operating at its current burn rate before it runs out of cash, calculated simply as cash on hand divided by monthly burn rate. Every major decision, from a new hire to a marketing spend increase, should be weighed against how many months of runway it costs.
Break-even analysis identifies the point at which revenue covers total costs, both fixed and variable. For a pre-revenue or early-revenue startup, this is often the clearest way to communicate to investors exactly what it will take for the business to become self-sustaining.
Unit economics, meaning the revenue and cost attributable to a single customer or transaction, tell a founder whether the business model actually works before it is scaled. A company that loses money on every unit will not fix that by selling more units faster; it will simply burn cash faster.
None of these replace the core techniques above. A startup still needs ratio analysis and cash flow analysis. But burn rate, runway, and unit economics are the numbers that determine whether the company gets to use the other techniques at all.
Common mistakes in financial analysis, and how to avoid them
Reading a ratio without a benchmark. A debt-to-equity ratio of 1.5 means nothing on its own. Whether it is healthy depends entirely on the industry and on whether it is trending up or down from the company’s own recent history.
Treating the income statement as the whole picture. A business can show a strong net profit and still run out of cash if receivables are piling up or a large capital purchase just went out the door. Cash flow analysis has to run alongside profitability analysis, not after it.
Ignoring one-time items. A large legal settlement or an asset sale can distort a single period’s numbers enough to make a trend look better or worse than it really is. Adjusted figures, with one-time items flagged and excluded, should be the basis for any trend or ratio comparison.
Comparing companies without adjusting for accounting differences. Two businesses using different depreciation methods or revenue recognition policies are not directly comparable without adjustment, even if they are the same size in the same industry.
Doing the analysis once a year. Financial analysis loses most of its value as a diagnostic tool if it only happens at year-end. By then, a margin problem that started in month three has had nine months to compound.
Frequently Asked Questions
What is the most important financial analysis technique for a small business?
Cash flow analysis, in most cases. Profitability matters, but a small business is far more likely to fail from running out of cash than from a quarter of thin margins.
How often should a business perform financial analysis?
Monthly for cash flow and key ratios, quarterly for a fuller ratio review, and at least annually for a comprehensive analysis that includes trend and benchmarking work across multiple years.
What is the difference between financial analysis and financial modeling?
Financial analysis examines what has already happened, using historical statements to assess current health. Financial modeling builds a forward-looking projection of what is likely to happen, often using the patterns that financial analysis uncovers as its starting assumptions.
Can a business be profitable and still fail?
Yes, and it happens often. A profitable company can still run out of cash if receivables are collected slowly, inventory ties up too much capital, or a large one-time expense hits at the wrong moment. This is exactly why cash flow analysis has to run alongside profitability analysis rather than being treated as a secondary check.
What ratios should an investor look at before investing in a company?
Most investors work through liquidity ratios first to confirm short-term survival, then profitability and leverage ratios to assess whether returns are sustainable rather than driven by excessive debt, and finally efficiency ratios to see how well the business converts its resources into revenue.
Conclusion
Financial analysis is not a once-a-year report for the accountant to file away. It is the running diagnostic that tells a business owner whether the company is getting healthier or sicker, and it works best when the right technique is matched to the right question: horizontal and vertical analysis for trends and structure, ratio analysis for standardized comparison, cash flow analysis for survival, and burn rate and runway for any company still finding its footing.
Most owners do not lack the numbers. They lack the time to turn those numbers into a clear read on where the business stands and what to do next. That is precisely the gap a fractional CFO is built to close: someone who runs this analysis on a regular cadence, flags the trend before it becomes a crisis, and connects the diagnosis to an actual plan. If that sounds like the piece missing from your own financial picture, Oak Business Consultant’s CFO services are a reasonable place to start the conversation.