What is Financial Ratio Analysis and Why is it Vital for Business Success?
What is Financial Ratio Analysis?
What separates thriving businesses from struggling ones is rarely luck. It is the habit of reading the numbers behind the numbers. Financial ratio analysis is exactly that skill.
What Is Financial Ratio Analysis?
Financial ratio analysis is the process of taking numbers from a company’s financial statements and turning them into meaningful comparisons. Instead of staring at a wall of figures in an income statement or balance sheet, you calculate ratios that tell a clear story about performance, risk, and opportunity.
Think of it like a health checkup. A doctor does not just look at you and guess whether you are healthy. They measure blood pressure, cholesterol, and heart rate, then compare those numbers against established benchmarks. Financial ratios do the same thing for a business.
The three financial statements that feed into ratio analysis are:
- The Income Statement (revenues, expenses, and profits over a period)
- The Balance Sheet (assets, liabilities, and equity at a point in time)
- The Cash Flow Statement (actual cash moving in and out of the business)
By cross-referencing numbers from these documents, you can answer questions like: Can we pay our bills next month? Are we making enough profit on each sale? Are we taking on too much debt? These are the questions that keep business owners up at night, and financial ratio analysis gives you real answers.
Why It Matters for Business Success
Here is the honest truth: most businesses that fail do not fail because they had a bad idea. They fail because the people running them did not see the warning signs early enough. Financial ratios are early warning systems.
They are also tools for growth. When you understand what is working in your financials and what is not, you can make strategic decisions with confidence instead of guesswork. Lenders and investors rely heavily on ratio analysis before committing capital, so knowing your own ratios puts you in a much stronger position at the negotiating table.
In short, financial ratio analysis helps you:
- Spot financial problems before they become crises
- Compare your performance to industry benchmarks
- Track progress over time
- Make a compelling case to investors or lenders
- Identify where to cut costs or double down on investment
How Financial Ratios Work
Every financial ratio is simply one number divided by another. The magic is in choosing which numbers to compare and knowing how to interpret the result.
For example, the Return on Assets (ROA) ratio answers the question: “For every dollar of assets we own, how much profit are we generating?”
Return on Assets (ROA) = Net Income / Total Assets
If a company has a net income of $200,000 and total assets worth $2,000,000, the ROA is 10%. Whether that is good or bad depends on the industry. A 10% ROA would be excellent in some sectors and below average in others. That is why comparing your ratios to industry averages and your own historical performance is just as important as calculating them.
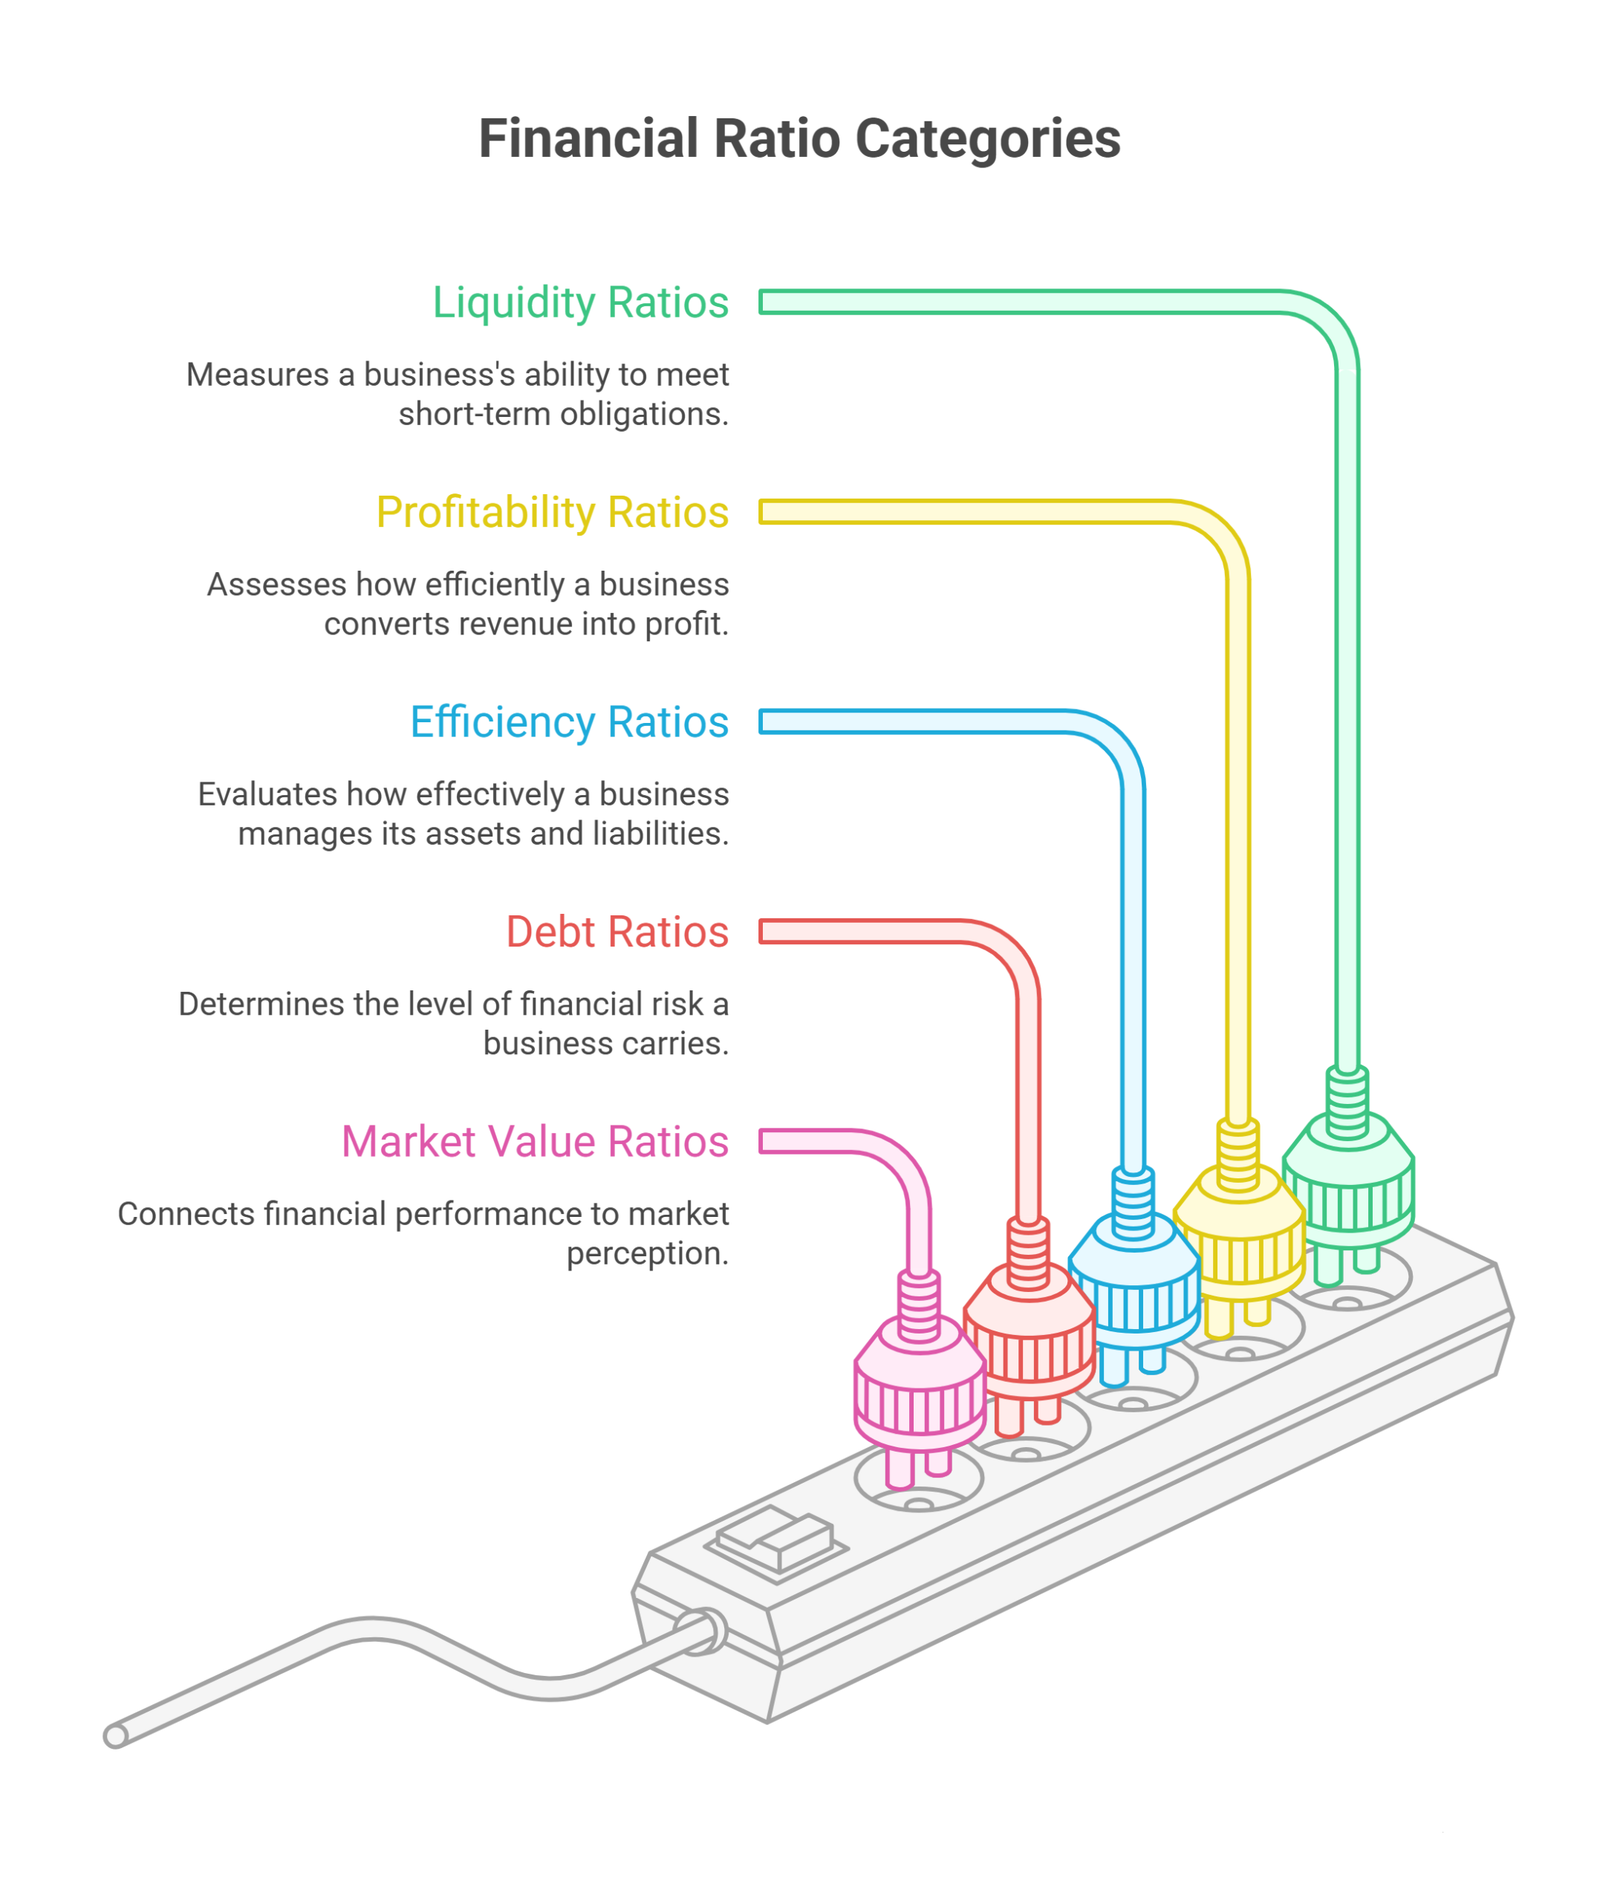
The 5 Categories of Financial Ratios
1. Liquidity Ratios
The question they answer: Can we pay our short-term bills?
Liquidity ratios measure whether a business has enough liquid assets to cover its near-term obligations. If these ratios look weak, the business may struggle to pay suppliers, employees, or lenders, even if it is technically profitable on paper.
Current Ratio
The current ratio compares everything you own that can be converted to cash within a year against everything you owe within a year.
Current Ratio = Current Assets / Current Liabilities
A ratio above 1.0 means you have more current assets than current liabilities. A ratio of 2.0 is often cited as a healthy benchmark, though this varies by industry. Moreover, a ratio below 1.0 is a red flag worth investigating immediately.
Quick Ratio (Acid-Test Ratio)
The quick ratio is stricter. It strips out inventory because inventory is not always easy to convert to cash quickly. This gives a more conservative view of short-term liquidity.
Quick Ratio = (Current Assets – Inventory) / Current Liabilities
Cash Ratio
The most conservative of the three. It only counts cash and cash equivalents against current liabilities.
Cash Ratio = Cash and Cash Equivalents / Current Liabilities
Operating Cash Flow Ratio
This one looks at how much cash your actual operations generate relative to your current liabilities. It is a reality check, because profits can be engineered through accounting methods, but cash flow is harder to fake.
Operating Cash Flow Ratio = Operating Cash Flow / Current Liabilities
Absolute Liquidity Ratio
Absolute Liquidity Ratio = (Cash + Marketable Securities) / Current Liabilities
Why liquidity ratios matter: Knowing your liquidity position helps you plan for lean periods, decide whether you can afford to expand, and demonstrate creditworthiness to financiers. Strong liquidity ratios are reassuring to anyone considering lending money to your business.
2. Profitability Ratios
The question they answer: Are we actually making money?
A business can generate millions in revenue and still be unprofitable. Profitability ratios cut through the noise and show you how efficiently the company converts revenue and assets into profit.
Gross Profit Margin (GPM)
This tells you how much profit remains after paying for the direct costs of producing your goods or services.
Gross Profit Margin = (Revenue – Cost of Goods Sold) / Revenue
A declining gross margin over time usually signals rising production costs or pricing pressure from competitors. An improving gross margin suggests better efficiency or stronger pricing power.
Return on Assets (ROA)
Already introduced above, ROA shows how productive your assets are.
ROA = Net Income / Total Assets
Return on Equity (ROE)
ROE measures how much profit shareholders earn for every dollar they have invested in the business. It is one of the first numbers investors look at.
ROE = Net Income / Shareholders’ Equity
A high ROE relative to peers signals that management is generating strong returns from shareholder capital. A consistently low ROE raises questions about whether the business is a good use of invested money.
Net Profit Margin
This ratio captures the bottom line: what percentage of total revenue actually becomes profit after all expenses are paid.
Net Profit Margin = Net Income / Revenue
Why profitability ratios matter: Trends in these ratios over time reveal whether the business is becoming more or less efficient. They help you pinpoint which costs are eating into margins and identify where pricing or operations might need adjustment.
3. Efficiency Ratios
The question they answer: How well are we using our resources?
Efficiency ratios, sometimes called activity ratios, measure how effectively a company manages its assets and liabilities in day-to-day operations. Even a profitable business can run into trouble if it manages its inventory poorly or takes too long to collect payments.
Inventory Turnover
This ratio shows how many times your inventory is sold and replaced over a period.
Inventory Turnover = Cost of Goods Sold / Average Inventory
A high turnover rate generally means products are selling well. A low turnover rate may indicate overstocking, slow-moving products, or poor purchasing decisions. However, an extremely high turnover can also mean you are running out of stock and potentially losing sales.
Accounts Receivable Turnover
This measures how many times per period you collect your outstanding receivables in full.
AR Turnover = Net Sales / Average Accounts Receivable
A low AR turnover means customers are taking a long time to pay. This can create cash flow problems even when sales are strong.
Days Sales Outstanding (DSO)
DSO translates AR turnover into the average number of days it takes to collect payment after a sale.
DSO = (Accounts Receivable / Net Credit Sales) x Number of Days
A rising DSO is a warning sign. It means cash is getting tied up in unpaid invoices, which puts pressure on liquidity.
Why efficiency ratios matter: They reveal operational bottlenecks. A business with great margins but terrible inventory management or slow collections may find itself chronically short on cash despite strong sales. These ratios help you identify and fix those operational leaks.
4. Debt Ratios (Leverage Ratios)
The question they answer: How much debt are we carrying, and can we handle it?
Debt is a tool. Used wisely, it accelerates growth. Used recklessly, it can sink a business. Debt ratios help you assess how much leverage your business is carrying and whether that level is sustainable.
Debt-to-Assets Ratio
This shows what percentage of your total assets are financed by borrowed money.
Debt-to-Assets Ratio = Total Liabilities / Total Assets
A ratio of 0.5 means half your assets are funded by debt. The closer this number is to 1.0, the more leveraged (and potentially vulnerable) the business is.
Debt-to-Equity Ratio
This compares how much money creditors have put into the business versus how much equity owners have contributed.
Debt-to-Equity Ratio = Total Liabilities / Shareholders’ Equity
Lenders and investors watch this ratio closely. A high debt-to-equity ratio may make it harder to secure additional financing, while a very low ratio might suggest the business is not taking advantage of available leverage to grow.
Interest Coverage Ratio
Can the business comfortably pay the interest on its debts? This ratio tells you.
Interest Coverage Ratio = EBIT / Interest Expense
(EBIT = Earnings Before Interest and Taxes)
A ratio below 1.5 is generally considered risky. It means the business is barely generating enough operating income to cover its interest payments. A ratio above 3.0 is a sign of comfortable financial cushion.
Why debt ratios matter: They determine how much financial risk the business is carrying and how much room remains for additional borrowing if needed. They are critical inputs for any strategic decision involving significant capital, whether that is acquiring equipment, buying a competitor, or expanding into a new market.
5. Market Value Ratios
The question they answer: How does the market value our business?
Market value ratios are especially relevant for publicly traded companies or businesses being valued for investment or acquisition. They connect financial performance to market perception.
Earnings Per Share (EPS)
EPS shows how much profit is attributable to each outstanding share of common stock.
EPS = (Net Income – Preferred Dividends) / Average Outstanding Common Shares
Growing EPS over time signals improving profitability per shareholder. Declining EPS raises concerns about business performance or dilution from new share issuances.
Price-to-Earnings Ratio (P/E)
The P/E ratio compares a company’s share price to its earnings per share.
P/E Ratio = Share Price / Earnings Per Share
A high P/E ratio suggests investors expect strong future growth. A low P/E may indicate the stock is undervalued, or that the market has doubts about the company’s future. Context is everything: comparing P/E ratios within the same industry is far more meaningful than comparing across different sectors.
Return on Equity (ROE)
ROE appears again here because investors use it as a market value metric to compare opportunities.
ROE = Net Income / Shareholders’ Equity
Why market value ratios matter: For business owners not listed on a stock exchange, these ratios still matter at exit. When you eventually sell your business or seek major investment, buyers and investors will apply these frameworks to value what you have built. Understanding how they think puts you in a stronger negotiating position.
Common Pitfalls to Avoid
Even experienced analysts make mistakes with ratio analysis. Here are the most common ones and how to steer clear of them.
Looking at ratios in isolation. One ratio alone tells you very little. The power comes from looking at multiple ratios together to build a complete picture. A high debt-to-equity ratio is less alarming if liquidity ratios are strong and the interest coverage ratio is healthy.
Ignoring industry context. A current ratio of 1.2 might be perfectly acceptable in retail but concerning in manufacturing. Always benchmark against peers in your industry.
Comparing companies of different sizes. Ratios are better tools for comparison than raw numbers, but significant size differences between companies can still distort comparisons.
Using only one period’s data. Trends matter more than snapshots. A ratio that looks acceptable today may be on a downward trajectory that signals trouble ahead.
Treating accounting numbers as gospel. Financial statements can be manipulated within the bounds of accounting rules. Cash flow ratios are generally harder to game than earnings-based ratios, so weighting them appropriately adds analytical rigor.
How to Build a Ratio Analysis Habit
Knowing the ratios is one thing. Actually using them consistently is where most business owners fall short. Here is a practical framework for making ratio analysis a regular part of how you run your business.
Set a monthly review cadence. Calculate your core liquidity and cash flow ratios monthly. These change quickly and need frequent attention.
Do a deeper quarterly review. Each quarter, run the full suite: liquidity, profitability, efficiency, debt, and market value ratios. Compare them to the same quarter last year and to industry benchmarks.
Create a simple dashboard. You do not need sophisticated software. A well-organized spreadsheet that tracks key ratios over time gives you trend visibility at a glance.
Act on what you find. Analysis without action is just an exercise. If your DSO is creeping up, tighten your invoicing process. If gross margins are shrinking, investigate your cost structure or pricing strategy.
Get a second opinion. A financial consultant or fractional CFO can catch things you might miss and help interpret ratios in the context of your specific business model and industry.
Frequently Asked Questions
What is a “good” ratio and what is a “bad” one?
There is no universal answer. What counts as a healthy ratio depends heavily on your industry, your business model, and the stage your company is in. A startup will naturally have different ratios than a mature company. The most meaningful benchmark is your industry average combined with your own historical trend. A ratio that is improving over time is usually a positive sign regardless of where it starts.
Can a business be profitable and still have financial problems?
Absolutely, and this is one of the most important lessons of ratio analysis. A business can show strong profits on the income statement while simultaneously running out of cash. This happens when profits are tied up in unpaid invoices, excess inventory, or are being consumed by debt repayment. Liquidity and cash flow ratios specifically exist to catch this kind of situation before it becomes a crisis.
Which ratio should I focus on first if I am new to financial analysis?
Start with the current ratio and net profit margin. The current ratio tells you immediately whether you can cover your near-term obligations, and the net profit margin tells you whether the core business is actually generating profit. Once you are comfortable with those, layer in the others progressively.
Are financial ratios useful for startups?
Yes, though with some nuance. Early-stage startups often have unusual ratios because they are pre-revenue or investing heavily in growth. The key is to use ratios to track progress rather than compare against established benchmarks, and to pay particular attention to cash burn ratios and the runway they imply.
Conclusion
Financial ratio analysis is not a tool reserved for accountants or Wall Street analysts. It is a practical skill that every business owner, manager, and investor should develop. When you understand how to read these numbers, you stop reacting to financial problems after they have already done damage and start seeing them coming far enough in advance to do something about it.
The five categories covered here, liquidity, profitability, efficiency, debt, and market value, give you a 360-degree view of your business. No single ratio tells the whole story, but together they build a picture that is hard to misread. The businesses that stay ahead of the curve are the ones that treat ratio analysis as a regular management practice, not a one-time exercise.
Start with the ratios most relevant to your immediate concerns. Build from there. Over time, you will develop an intuitive sense for what the numbers are telling you, and that instinct is one of the most valuable skills a business leader can have.Are you tracking your financial ratios, or just guessing your business’s health? A healthy profit margin doesn’t mean much if your cash is trapped in unpaid invoices or excess inventory. Oak Business Consultant provides Fractional CFO services that look past raw data to map out your liquidity, efficiency, and leverage ratios—spotting operational risks and structural leaks before they become crises. Schedule Your Free Financial Strategy Session.