What is Financial Analysis? A Holistic Guide
What is financial analysis? A complete guide for business owners
Most business owners can tell you if last month was good or bad. Fewer can tell you why, or what it means for next quarter. That gap between knowing your numbers and understanding them is exactly what financial analysis closes.
Financial analysis is the process of examining a company’s financial data, mainly the income statement, balance sheet, and cash flow statement, to understand performance, spot risk, and support a decision. It is not the same thing as bookkeeping or accounting. Accounting produces the numbers. Financial analysis asks what those numbers actually mean and what to do about it.
This guide walks through what financial analysis covers, why it matters, and the specific types every business owner, founder, or finance lead should recognize, along with the key metrics tied to each one.
Why financial analysis matters
A business can be profitable on paper and still run out of cash. It can grow revenue every quarter and still be less efficient than it was two years ago. Financial analysis is what surfaces problems like these before they become emergencies, and it is what turns a hunch about the business into something you can actually act on.
It also matters because other people are looking at your numbers even when you are not. Lenders analyze your leverage and liquidity before approving a loan. Investors analyze your growth and returns before writing a check. Buyers analyze your cash flow and margins before making an offer. A business that understands its own financial analysis is negotiating from a position of knowledge instead of hope.
Common reasons businesses run financial analysis include:
Financial forecasting and planning, financial modeling for a raise or expansion, financial statement analysis for internal reporting, risk assessment, measuring growth against competitors, evaluating a merger or acquisition, and assessing creditworthiness for a loan or credit line.
The three statements financial analysis is built on
Nearly every type of financial analysis pulls from the same three sources.
The income statement shows revenue, costs, and profit over a period of time. It answers whether the business is making money. The balance sheet shows assets, liabilities, and equity at a single point in time. It answers what the business owns, what it owes, and what is left over. The cash flow statement shows cash moving in and out across operating, investing, and financing activities. It answers whether the business can actually pay its bills, which the income statement alone cannot tell you.
Most of the analysis types below use one or more of these three statements as the raw input.
Types of financial analysis
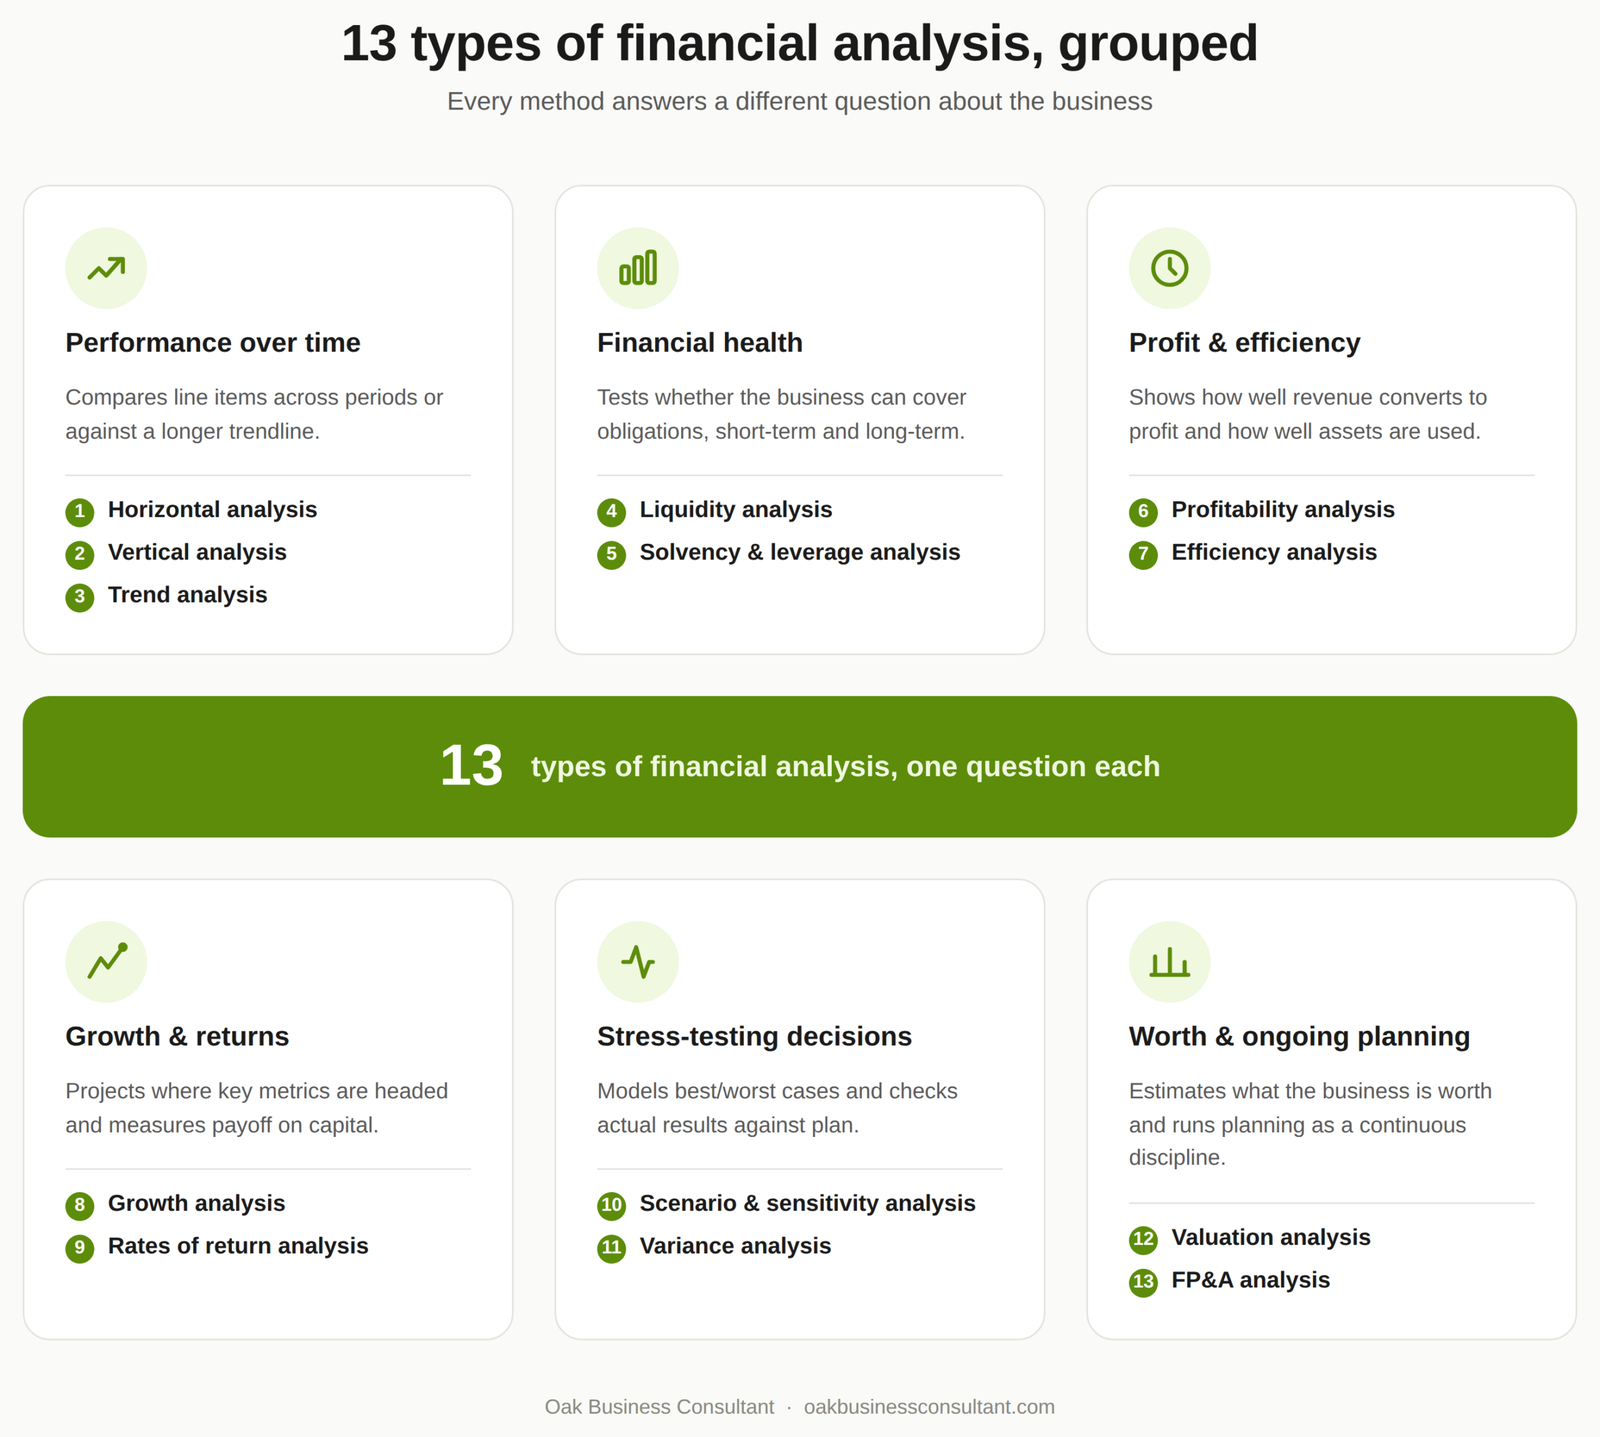
There is no single “right” type of financial analysis. Different questions call for different tools. Below are the types that come up most often in practice, grouped by what question each one answers.
1. Horizontal analysis
Horizontal analysis compares the same line item across multiple periods, month over month, quarter over quarter, or year over year, to see how it has changed. If revenue was $2 million last year and $2.4 million this year, horizontal analysis expresses that as a 20% increase and asks what drove it.
It is one of the simplest ways to spot a trend, but it has a real limitation: a spike caused by a one-off event, like a seasonal promotion or a single large contract, can look identical to a genuine underlying trend. Horizontal analysis works best paired with a second data source rather than used alone.
2. Vertical analysis
Vertical analysis expresses each line item on a financial statement as a percentage of a base figure, usually total revenue on the income statement or total assets on the balance sheet. This is also called a common-size statement, because it lets you compare companies of very different sizes on the same scale.
If cost of goods sold is 60% of revenue this year versus 55% last year, vertical analysis flags that margin compression immediately, even before you calculate the dollar impact. It is one of the fastest ways to benchmark your own business against industry norms.
3. Trend analysis
Trend analysis looks at financial data over a longer stretch, typically three or more years, to identify a consistent direction rather than a single-period change. Where horizontal analysis compares two points, trend analysis looks at the whole line.
The main risk is treating a trend as guaranteed to continue. Past growth does not predict future growth on its own, which is why serious forecasting always pairs trend analysis with other inputs like market conditions and known upcoming changes to the business.
4. Liquidity analysis
Liquidity analysis measures whether a business can cover its short-term obligations, generally anything due within a year, using cash or assets that convert to cash quickly.
The main liquidity ratios are:
The current ratio, which divides current assets by current liabilities. The quick ratio (also called the acid test), which excludes inventory since it is often the slowest asset to convert to cash. The cash ratio, which looks only at cash and cash equivalents against current liabilities. Net working capital, which is current assets minus current liabilities in dollar terms rather than as a ratio.
A business can be profitable and still fail a liquidity test, which is why lenders check this before almost anything else.
5. Solvency and leverage analysis
Solvency analysis looks at a business’s ability to meet long-term obligations and stay financially stable over years, not months. Leverage analysis is the specific set of ratios used to do it, measuring how much of the business is funded by debt versus equity.
Key leverage ratios include:
Debt-to-equity, which compares total debt to shareholder equity. Debt-to-EBITDA, which lenders use to gauge how many years of earnings it would take to pay off debt. Interest coverage (EBIT divided by interest expense), which shows how comfortably a business can cover its interest payments.
A business that looks profitable but carries a debt-to-EBITDA ratio well above industry norms is often one bad quarter away from a covenant problem or a difficult refinancing conversation.
6. Profitability analysis
Profitability analysis examines how well a business converts revenue into actual profit, and where along the way that profit gets eaten up.
Common profitability metrics:
Gross margin, which shows profit after direct production costs. EBITDA margin, which strips out interest, tax, depreciation, and amortization to compare operating performance. EBIT margin, which includes depreciation and amortization but excludes interest and tax. Net profit margin, the bottom-line percentage after every expense.
Looking at all four together, not just net margin, usually reveals exactly where money is being lost: production costs, overhead, financing costs, or taxes.
7. Efficiency analysis
Efficiency analysis measures how well a business uses its assets to generate revenue. Two companies can have identical profit margins and very different efficiency, because one is generating that profit from a fraction of the assets the other needs.
Common efficiency ratios:
Asset turnover ratio, which divides revenue by total assets. Inventory turnover ratio, which shows how many times inventory is sold and replaced in a period. Fixed asset turnover, which isolates the productivity of property, plant, and equipment specifically.
This type of analysis matters most for asset-heavy businesses like manufacturing, retail, and distribution, where tying up capital in slow-moving inventory or underused equipment is a direct hit to returns.
8. Growth analysis
Growth analysis tracks how key metrics, usually revenue, but also profit, customer count, or units sold, change over time and projects where they are headed.
The main approaches are:
Year-over-year (YoY) comparison, the simplest and most common. Regression analysis, which fits historical data to a statistical model to project a trend line. Bottom-up forecasting, which builds a growth projection from individual revenue drivers like units sold and price per unit. Top-down forecasting, which starts from total market size and estimated market share.
Bottom-up and top-down forecasts frequently disagree, and that disagreement is often the most useful part of the exercise. It forces a business to reconcile what its own sales pipeline supports against what the total market can realistically bear.
9. Rates of return analysis
Rates of return measure how efficiently a business, or an investment in it, generates a financial payoff. This is the analysis lenders, investors, and owners all care about most directly, because it answers “is this worth the money.”
Common rate of return metrics:
Return on equity (ROE), net income divided by shareholder equity. Additionally, return on assets (ROA), net income divided by total assets. Return on invested capital (ROIC), which measures return against all capital invested, debt and equity combined. Internal rate of return (IRR), used heavily in evaluating whether a specific project or investment clears the required hurdle rate.
A business with strong margins but weak ROIC is often over-invested in assets that are not pulling their weight, a pattern that profitability analysis alone will not catch.
10. Scenario and sensitivity analysis
Scenario analysis builds out a best case, worst case, and most likely case to see how a decision performs under different conditions. Sensitivity analysis takes this further by isolating one variable at a time (a price change, a cost increase, a shift in customer demand) to see exactly how much it moves the outcome.
This is standard practice before a major decision: launching a new product line, entering a new market, or committing to a large capital expenditure. It replaces “we think this will work” with “here’s what happens if it doesn’t.”
11. Variance analysis
Variance analysis compares actual results against a budget or forecast and investigates the gap. A $2.5 million revenue budget against $2.6 million actual results is a $100,000 favorable variance, and the next question is always why: higher volume, higher prices, or something else entirely.
Run consistently, variance analysis catches operational problems early, whether that is a department overspending, a sales channel underperforming, or a cost assumption that was wrong from the start.
12. Valuation analysis
Valuation analysis estimates what a business, or a specific asset within it, is actually worth. It matters most during a fundraise, an acquisition, a sale, or when issuing equity to employees or new partners.
The three main approaches:
The cost approach, based on what it would cost to rebuild or replace the asset. The market approach, using comparable company analysis or precedent transactions to benchmark against similar deals. The income approach, most commonly a discounted cash flow (DCF) model, which values a business based on its projected future cash flows.
No single method is considered definitive on its own. A credible valuation usually triangulates across at least two of the three.
13. FP&A analysis
Financial planning and analysis (FP&A) is less a single technique and more the ongoing discipline of budgeting, forecasting, and analyzing financial data to guide decisions across the business. It draws on most of the analysis types above and applies them continuously rather than as a one-time exercise.
FP&A typically covers budgeting and forecasting, cash flow and liquidity planning, and capital structure decisions, run on a regular cadence (monthly or quarterly) rather than once a year.
Who actually uses this analysis
Financial analysis serves two different audiences, and it is worth being clear on which one you are producing it for.
Internal analysis guides decisions inside the business: where to cut costs, which product line to expand, whether to hire. External analysis is built for outside parties, lenders assessing a loan, investors assessing a raise, or a buyer assessing an acquisition, and it needs to hold up under scrutiny that internal numbers rarely face. The two are related but not identical; a forecast built only for internal planning is often not built to survive a lender’s or investor’s diligence process.
Financial analysis types at a glance
| Type | Main question it answers | Key metrics |
| Horizontal | How has this changed period to period? | YoY growth, period-over-period change |
| Vertical | How is the statement structured proportionally? | % of revenue, % of total assets |
| Liquidity | Can we cover short-term obligations? | Current ratio, quick ratio, cash ratio |
| Solvency/leverage | Can we meet long-term debt obligations? | Debt/equity, debt/EBITDA, interest coverage |
| Profitability | How much of revenue turns into profit? | Gross, EBITDA, EBIT, net margin |
| Efficiency | How well do we use our assets? | Asset turnover, inventory turnover |
| Growth | Where are we headed? | YoY, regression, bottom-up/top-down |
| Rates of return | Is this worth the capital invested? | ROE, ROA, ROIC, IRR |
| Scenario/sensitivity | What happens if conditions change? | Best/worst/likely case outcomes |
| Variance | Why did actuals differ from plan? | Budget vs. actual variance |
| Valuation | What is this business or asset worth? | DCF, comparable company, precedent transactions |
Getting started with financial analysis
You do not need every type of analysis running at once. Most businesses get the most value starting with three: liquidity analysis to confirm short-term survival, profitability analysis to confirm the business model works, and variance analysis to catch problems against plan early. From there, add growth, rates of return, and valuation analysis once you are actively raising capital, borrowing, or considering a sale.
Tracking a small set of key financial metrics consistently over time will tell you more than running every analysis type once and never revisiting it.
Frequently Asked Questions
What is the difference between financial analysis and financial modeling?
Financial analysis examines what has already happened using historical data. Financial modeling builds forward-looking projections, often using the same metrics and ratios financial analysis produces as its starting assumptions.
How often should a business run financial analysis?
Liquidity and variance analysis benefit from a monthly cadence. Growth, profitability, and efficiency analysis are usually reviewed quarterly. Valuation analysis is typically done around a specific event: a raise, a sale, or an acquisition.
Do small businesses need all of these types of analysis?
No. A small business with no debt and no plans to raise capital gets the most value from liquidity, profitability, and variance analysis. Leverage, valuation, and rates of return analysis matter more once debt, investors, or an eventual sale are part of the picture.
What’s the most important financial analysis metric to track?
There isn’t one universal answer, since it depends on the business and its stage. That said, cash flow and liquidity metrics are the most common early-warning signal, since a business can look profitable on the income statement while still running out of cash.
Can financial analysis be done without a finance background?
The basic types, horizontal, vertical, and liquidity analysis, are straightforward to calculate and interpret. Valuation, scenario modeling, and FP&A generally benefit from professional support, since the assumptions behind them carry real weight in a fundraise, loan, or sale.
Conclusion
Financial analysis is not about producing more spreadsheets. It’s about being able to answer specific questions with confidence: can we make payroll in three months, is this product line actually profitable, is now the right time to raise debt or equity. The businesses that treat financial analysis as an ongoing habit, not a once-a-year exercise, are consistently the ones that see problems coming instead of finding out from a lender or an investor.
If you’re building out financial analysis for the first time, or need it to hold up under investor or lender scrutiny, Oak’s financial analysis team can build the reporting and models to get you there. Book a free consultation to talk through where your business stands today.