

How CFO Measures Forecast Accuracy?
Why Forecast Accuracy Is the CFO’s Most Important Job
Every strategic decision in a business rests on one foundation: the quality of the financial forecast. Yet most companies treat forecasting as a calendar obligation instead of a discipline. Numbers get submitted, actuals arrive months later, and the gap between the two gets quietly explained away in a footnote.
The best CFOs don’t let that happen. They measure forecast accuracy the same way they measure any other part of the business: with specific metrics, specific targets, and a system that catches errors before they compound.
This guide breaks down the six metrics finance leaders actually track, the numeric benchmarks that separate strong performers from average ones, and the technology and culture that make those benchmarks achievable.
What forecast accuracy actually means for a CFO
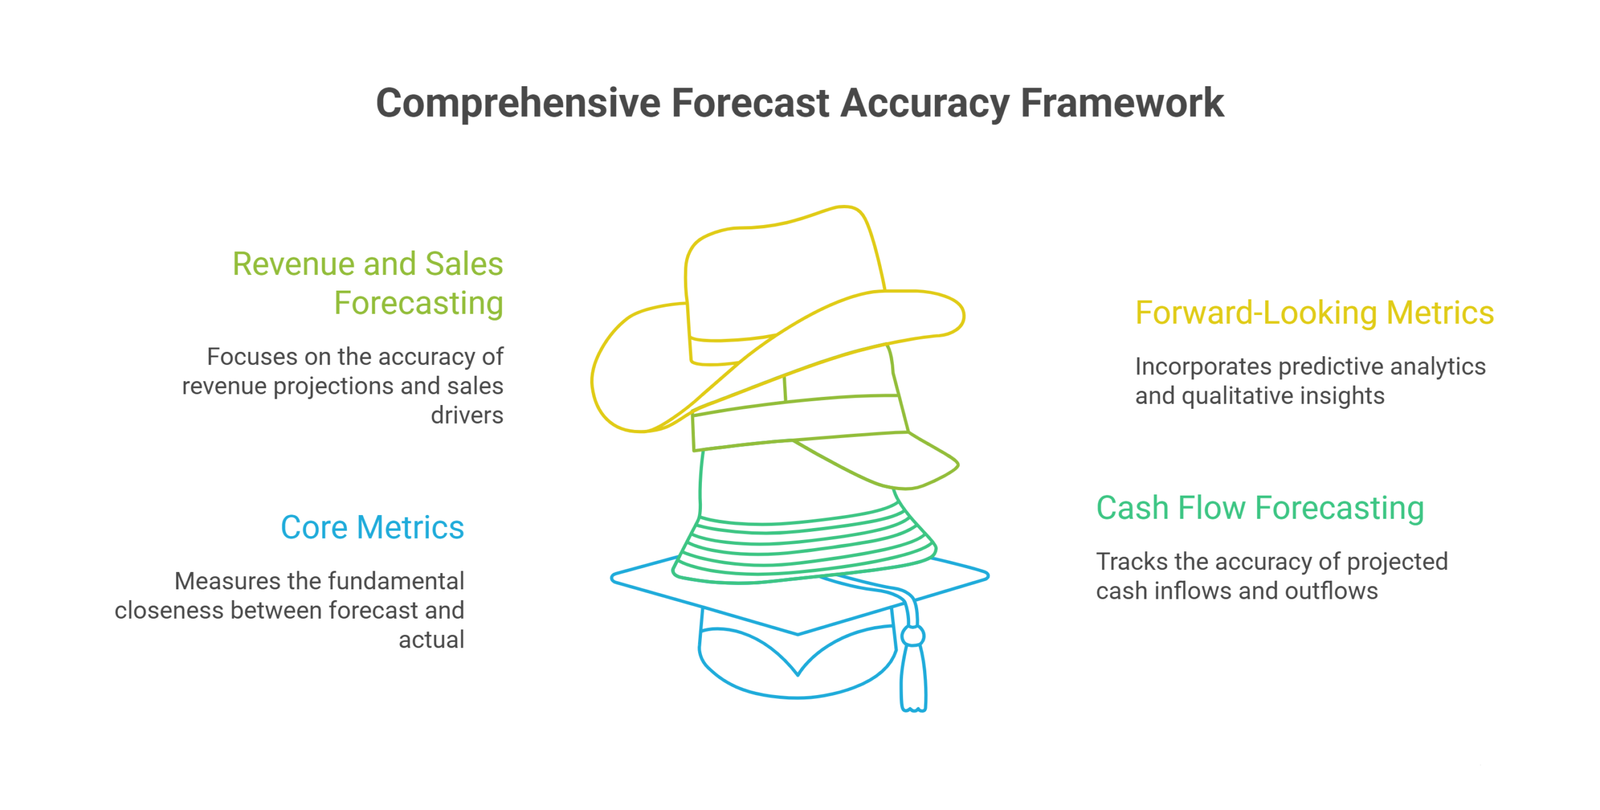
Forecast accuracy is the measured closeness between a financial projection and the actual result. For a CFO, though, it means more than a single number. It’s a signal about data quality, the strength of the underlying business model assumptions, and how well sales, operations, and finance communicate with each other.
A forecast that’s consistently 30% off on revenue but only 5% off on cash flow tells a story. So does a forecast that’s accurate in January and wildly inaccurate by Q3. Forecast accuracy isn’t one metric. It’s a diagnostic system.
When finance leaders ask how CFOs measure forecast accuracy, they’re really asking three questions:
- How far off was the forecast from actual results?
- Why did the variance happen?
- How long did it take to detect the variance and respond to it?
Each question maps to a different layer of measurement, and each layer needs its own tools and targets.
Layer 1: The six core accuracy metrics every CFO should track
Mean Absolute Percentage Error (MAPE)
MAPE is the most widely used benchmark in financial forecasting. It calculates the average absolute percentage difference between forecasted values and actual results.
A single “MAPE below 10%” rule of thumb undersells how much this varies by forecast horizon and business model. Leading finance teams target a MAPE of 5% or lower for quarterly revenue forecasts and 8% or lower for annual projections. High-growth SaaS companies with recurring revenue can often push toward 3-7% MAPE, while businesses with more variable revenue streams should expect targets closer to 8-12%. The point isn’t to hit one universal number. It’s to set a target that matches how predictable that specific revenue line actually is.
MAPE weights all errors equally regardless of direction, so pair it with directional accuracy measures to get the full picture.
Variance attribution rate
Variance attribution rate goes one step past MAPE. Instead of measuring the size of the error, it identifies the source. Was the variance driven by a market shift? A breakdown in pipeline health? Unexpected churn? A spike in variable costs?
Strong finance functions attribute 85-95% of significant variances to a specific, named cause, not a vague “revenue came in lower than expected.” When a team can trace variance to a root cause instead of just reporting the size of the miss, the organization can actually act on it.
Corrective-action lag
Corrective-action lag measures the time between spotting a significant variance and actually adjusting the forecast or the operational plan in response. A low lag means finance is agile. A high lag means the business is flying partially blind, making decisions on information that’s already gone stale.
Leading organizations keep corrective-action lag to 3-5 business days for operational issues and 1-2 weeks for larger strategic adjustments. A CFO with a technically perfect forecast but a slow response is nearly as exposed as one with a mediocre forecast, because the value of forecasting comes from what the business does with it, not the number itself.
Forecast cycle time
Forecast cycle time measures how long it takes to produce a new forecast, start to finish. Long cycle times mean decisions get made on stale data. Shorter cycle times, especially when powered by cloud-based ERP systems, give the business a real-time advantage.
A reasonable target is 5-7 business days for a monthly forecast and 10-12 business days for a quarterly one. Teams that automate data integration and cut out manual spreadsheet consolidation routinely see cycle times drop by half, without sacrificing accuracy.
Countdown accuracy analysis
Countdown accuracy analysis tracks how forecast accuracy improves, or deteriorates, as the forecast period gets closer. A 90-day revenue forecast might carry a MAPE of 18%. A 60-day forecast might drop to 11%. A 30-day forecast might reach 5%. Tracking that progression tells a CFO how far out the model can actually be trusted for major financial decisions.
Stakeholder adoption
This is the metric most forecasting frameworks skip, and it’s arguably the one that determines whether the other five even matter. Stakeholder adoption measures how much the forecast actually gets used in real decisions, not just how many people receive the report.
Strong organizations see 80-90% adoption among key stakeholders, tracked through system usage, meeting participation, and follow-up on forecast-driven recommendations. A forecast nobody trusts enough to act on is accurate in theory and useless in practice. Adoption is built through consistency: a forecast that’s been reliably close to actuals for two or three cycles in a row earns the trust that makes people change their decisions because of it.
Layer 2: Cash flow forecasting accuracy
Cash is where forecasting errors have the most immediate consequences. A revenue miss can usually be explained away. A cash flow miss can trigger a liquidity crisis inside a single quarter.
Cash flow forecasting accuracy tracks the variance between projected inflows and outflows and the actual cash position at any given point. For a SaaS business with subscription revenue, or a product company managing seasonal inventory, cash forecasting accuracy is often the difference between investing with confidence and reacting to survive.
CFOs should track this at multiple time horizons: weekly, monthly, and rolling 13-week windows. Weekly statements catch short-term timing mismatches. Monthly tracking picks up working capital trends. Rolling forecasts show the medium-term trajectory that affects balance sheet decisions and investor reporting.
Key metrics inside cash flow forecasting accuracy include:
- AR turnover accuracy: was collections timing predicted correctly?
- Cost of goods sold variance: were input costs forecasted accurately?
- Burn rate accuracy: especially critical for growth-stage companies
- Cash position variance at week-end versus forecast
Layer 3: Revenue and sales forecasting metrics
Revenue forecasting is where collaboration between finance and sales matters most, and where forecast errors are most common.
Pipeline health and deal momentum
Sales pipeline accuracy drives a large share of revenue forecast error. If CRM records aren’t updated consistently, or account stage classifications go stale, the whole forecast rests on shaky ground.
CFOs who build pipeline health reviews into the forecast cycle, not as a sales-only exercise but as a real finance input, consistently get better numbers. That means looking at weighted pipeline value, conversion rates by account stage, and average deal velocity, not just total pipeline value.
MRR waterfall and expansion MRR
For subscription and SaaS businesses, the MRR waterfall is one of the most useful forecasting tools available. It maps new MRR, expansion MRR, contraction MRR, and churned MRR into a full picture of net revenue movement.
Tracking expansion MRR separately from new customer acquisition MRR shows whether growth is coming from acquiring customers or from deepening existing accounts, a distinction that matters for both financial planning and customer lifetime value analysis.
Gross profit margin forecasting
Revenue forecasting without gross profit margin forecasting is incomplete. A CFO can hit revenue targets while missing profitability entirely, particularly if variable costs or cost of goods sold shift unexpectedly. Tracking gross margin forecast accuracy alongside revenue recognition timing gives a much cleaner read on real business performance.
Layer 4: Forward-looking metrics and qualitative inputs
Most forecasting frameworks measure what already happened. The best ones also measure how well the forecast captures what’s about to happen.
Predictive analytics and driver-based models
The move from static, historical models to driver-based models is one of the more important shifts in modern forecasting. Driver-based models connect operational inputs, like customer acquisition rates, employees per customer, or average revenue per customer, directly to financial outputs.
Machine learning models are seeing wider adoption for exactly this reason. According to McKinsey research, machine learning tools can reduce forecasting errors by 30-50% in mature organizations, primarily by catching nonlinear patterns in historical data that traditional analysis misses. The gains show up most clearly when the technology is paired with cross-functional planning, not deployed in a finance silo.
Qualitative insights and market intelligence
No amount of data replaces human judgment. The strongest forecasting frameworks blend quantitative analysis with qualitative input from sales teams, customer-facing staff, and market intelligence. A CFO who only reads the numbers and ignores what the sales pipeline is signaling through informal conversations will keep getting surprised by actuals.
AI-driven scenario planning
An AI-driven scenario planner lets CFOs model multiple futures at once: optimistic, base case, and downside, each with an assigned probability. This turns forecast accuracy from a backward-looking scorecard into a forward-looking management tool.
The technology stack that enables forecast accuracy
Understanding how CFOs measure forecast accuracy is incomplete without the infrastructure behind it. The most accurate forecasts run on integrated, real-time data pipelines, not year-old spreadsheets stitched together by hand.
Cloud-based ERP and CRM integration
Cloud-based ERP systems connected to CRM systems remove the manual data transfer that introduces timing errors and version-control problems. When revenue recognition data in the ERP and pipeline data in the CRM are talking to each other, the forecast runs on a single version of the truth.
Real-time dashboards and automated variance detection
Real-time dashboards let finance teams and business leaders watch forecast versus actual continuously, not just at month-end. Automated variance detection flags meaningful deviations as they happen, which is one of the fastest ways to cut corrective-action lag.
Data architecture: from spreadsheets to data lakes
Many mid-sized businesses still run forecasts from spreadsheets stitched together with manual exports. That creates data integrity risk and slows down cycle time. Moving toward proper data architecture, including data lakes and data fabric solutions, gives FP&A teams the ability to run faster, more granular forecasts with more confidence in the result.
BI solutions and predictive tools
A well-implemented BI platform connects historical data, real-time data, and forecasting models in one place. Predictive tools built on machine learning can model thousands of scenarios at once, surfacing the most likely outcomes and quantifying the risk around each.
Building a forecast accuracy culture through integrated business planning
The metrics and tools only work if the organization actually uses them. Adoption, not technology, is usually the harder problem to solve.
Sales teams need to understand why pipeline health matters to the financial forecast. Operations leaders need to connect their plans to cash flow projections. Senior leadership needs to treat forecast accuracy as a business health indicator, not a finance department scorecard that gets reviewed once a quarter.
Many organizations now formalize this through an Integrated Business Planning, or IBP, framework: a structure where finance plays a central but not solitary role, and sales, marketing, operations, and HR all feed into the same forecast cycle. IBP frameworks support frequent review cycles and faster adjustments when customer behavior, supplier conditions, or market pricing shift.
The CFO plays the central role in building this culture. Regular forecast reviews, run as strategic analysis rather than blame sessions, drive continuous improvement in accuracy across every function. Rolling forecasts, updated monthly instead of locked to an annual cycle, reinforce that the organization is working from the most current information available.
Common forecast errors and how to fix them
Even well-run finance functions make recurring mistakes. The most common:
- Over-relying on last year’s historical data without adjusting for market shifts or business model changes
- Ignoring customer churn signals in the revenue forecast
- Missing timing mismatches in the cash flow forecast, revenue recognized versus cash actually collected
- Building forecasts top-down without driver-based input from sales, operations, or HR
- Using a single-point forecast instead of a range built with an AI-driven scenario planner
Each of these shows up in variance attribution analysis. When the same variance driver appears quarter after quarter, that’s a signal the forecasting model itself needs to be redesigned, not just the numbers adjusted.
Frequently Asked Questions
What is the most important metric for measuring forecast accuracy?
It depends on the business. MAPE is the most common starting point, but cash-intensive businesses should weight cash flow accuracy higher, and growth-stage companies should weight MRR waterfall accuracy higher.
What is a good MAPE for financial forecasting?
5% or lower for quarterly revenue forecasts, 8% or lower for annual. A 30-day forecast should always beat a 90-day one.
How does machine learning improve forecast accuracy?
It catches nonlinear patterns in historical data that traditional methods miss. McKinsey research puts the potential error reduction at 30-50% in mature organizations.
What is corrective-action lag and why does it matter?
The time between spotting a variance and acting on it. Leading teams keep this to 3-5 days for operational issues and 1-2 weeks for strategic ones.
Why does stakeholder adoption matter if the forecast itself is accurate?
An accurate forecast nobody trusts enough to act on doesn’t change anything. Aim for 80-90% engagement among key stakeholders.
How can a CFO improve forecast accuracy without adding headcount?
Better technology: cloud ERP, CRM integration, automated variance detection, and AI-driven scenario planning. Stronger pipeline tracking and driver-based models help too.
Conclusion
How a CFO measures forecast accuracy is ultimately a question about organizational intelligence. Companies that forecast well make better investment calls, manage cash with more confidence, and build financial stability that compounds over time.
Forecast accuracy isn’t a finance department metric tucked into a monthly report. It’s a business strategy metric. When sales, operations, and senior leadership all treat it as a shared priority instead of finance’s problem to solve alone, the results show up in every line of the income statement, cash flow statement, and balance sheet.
If your business is struggling with forecast errors, slow corrective-action lag, or low confidence in your financial planning process, working with an experienced fractional CFO can change how those numbers come together. Oak Business Consultant’s CFO services build forecast accuracy systems, implement the right financial modeling tools, and embed the discipline your business needs for sustainable growth. Contact us today to close the gap between your forecast and your future.


