Top Digital Marketing Financial Models
Digital marketing financial model: 6 numbers that decide profit
A marketing business rarely fails because revenue stops. It fails because margin and cash drift apart. A client signs a $5,000 monthly retainer. The team spends 45 hours a month on work priced for 30. The invoice is paid 60 days late. On paper the account looks healthy. In the bank it costs money.
A digital marketing financial model shows this drift before it happens. It projects revenue, delivery cost, overhead, profit and cash month by month. A pricing or hiring decision gets tested in a spreadsheet first, not in payroll.
This guide covers what the model includes and the six numbers that drive it. A worked example with illustrative figures follows. The guide then matches model types to 16 kinds of digital business. It closes with a section on modeling a campaign budget when the goal is ROI instead of agency profit.
What a digital marketing financial model includes
A digital marketing financial model is a forecast of how money moves through a marketing business or a marketing budget. A financial statement records what already happened. A model projects what happens next, based on assumptions you state openly.
Five parts make up a working model.
| Part | Question it answers |
| Revenue forecast | What will clients pay, and when does each contract start and end? |
| Cost projection | What does it cost to deliver the work and run the business? |
| Profit calculation | What is left after delivery cost and overhead, by client and by service? |
| Cash flow forecast | Will cash arrive before payroll and vendor bills fall due? |
| Balance sheet | Can the business survive a lost client or a slow quarter? |
Each part feeds the next. One weak assumption in the revenue forecast flows through every other tab. That is why the six numbers below matter more than the template you pick.
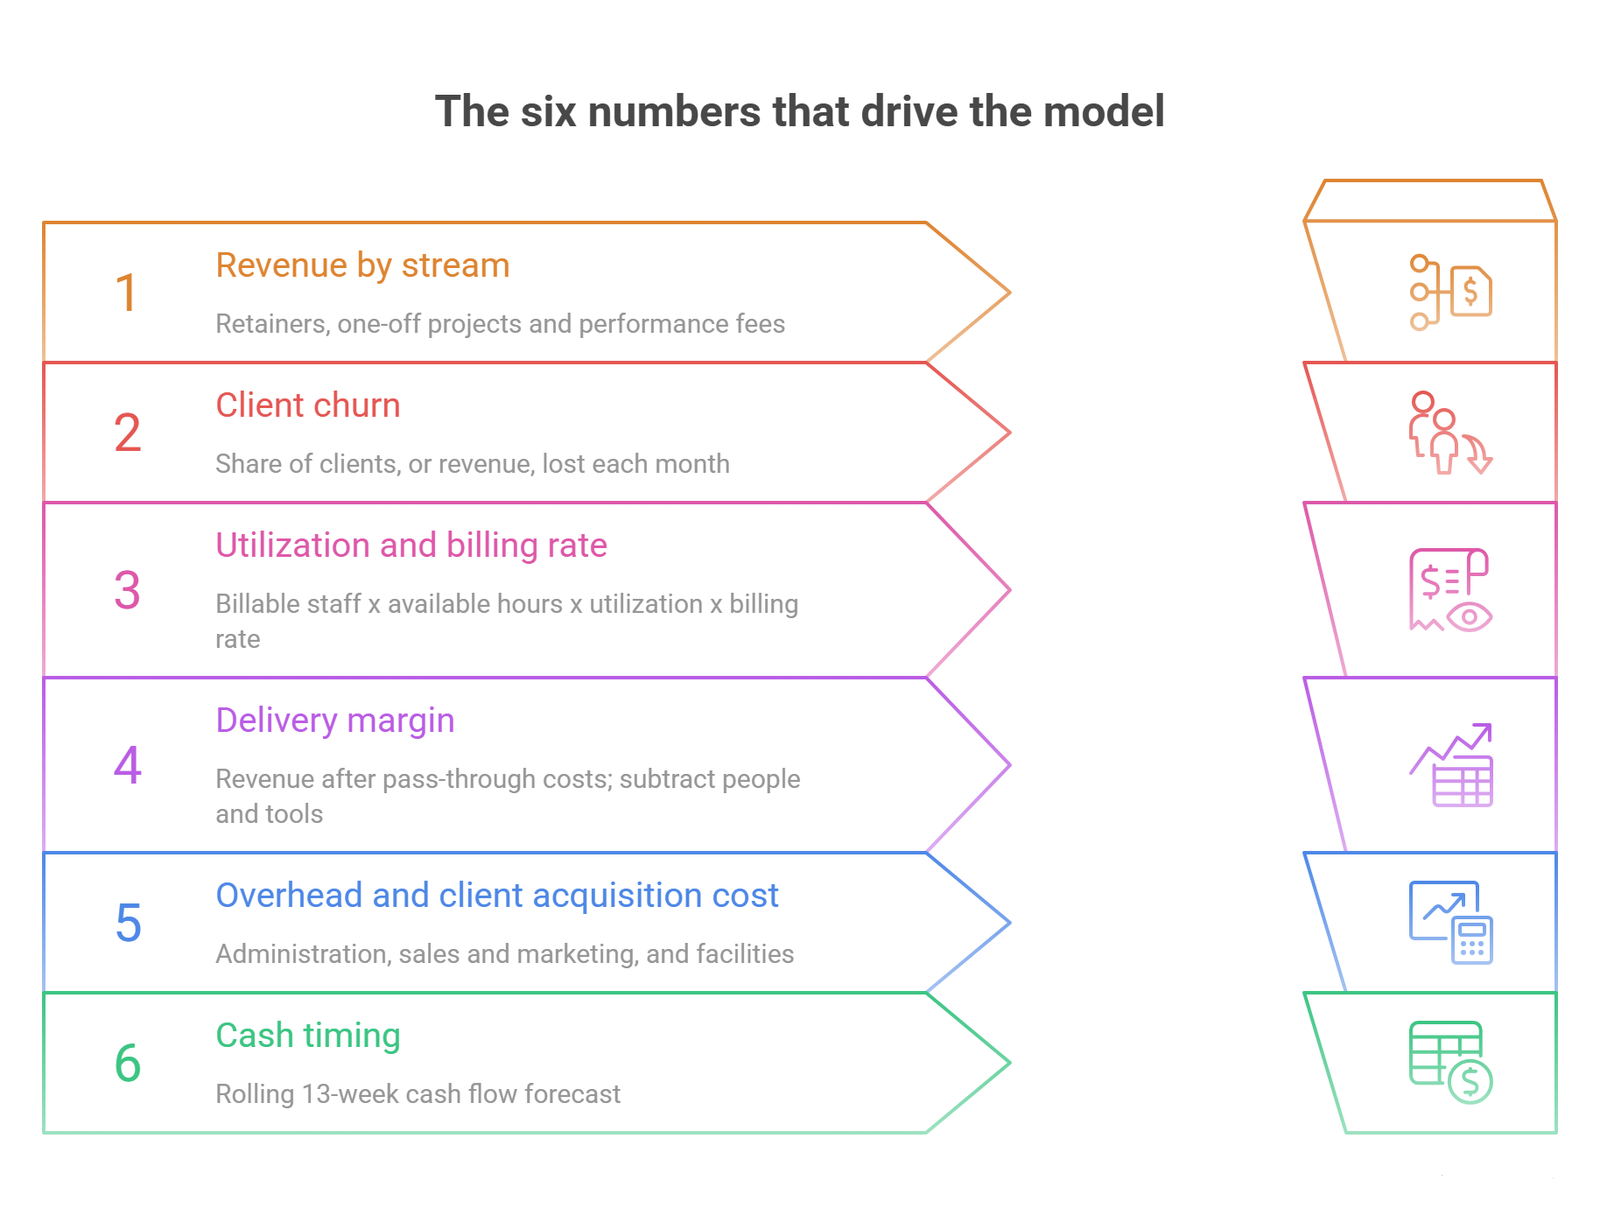
The six numbers that drive the model
1. Revenue by stream
Split revenue into retainers, one-off projects and performance fees. Retainers give steady income. Projects spike and fade. Performance fees depend on client results the agency does not fully control.
Model signed contracts apart from the pipeline. A verbal yes is upside, not forecast. Give every deal a start date, because a $5,000 retainer that starts next quarter pays no bills this month.
Pass-through spend needs its own line. When an agency buys media for clients, that money flows through and inflates revenue. Parakeeto, an agency profitability consultancy, calls revenue minus pass-through costs agency gross income. Margins measured on total revenue look better than they are.
2. Client churn
Churn is the share of clients, or revenue, lost each month. It sets the ceiling on growth. An agency that wins one client a month and loses one a month never grows.
Enter churn as a monthly percentage. Then run the model at several rates, such as 5%, 10% and 20% of clients lost over a year. The spread shows how fragile the plan is.
Track revenue share and hours share for every client. A client paying 10% of revenue but using 20% of delivery hours is being subsidized by the others.
3. Utilization and billing rate
Capacity caps revenue in any service business. The formula is simple:
Billable staff x available hours x utilization x billing rate = revenue capacity
Take four billable staff, 160 hours each per month, 75% utilization and an $85 hourly rate. Capacity is $40,800 a month. Mercury’s agency margin guide gives 70 to 80% as a healthy utilization range for most agencies. Admin, training, pitching and leave are never billable. A model that assumes 100% utilization overstates capacity by a third.
4. Delivery margin
Delivery margin shows how efficiently the agency turns work into profit. Take revenue after pass-through costs. Subtract the cost of the people and tools that do client work. Divide the result by that same revenue.
Parakeeto reports 50 to 60% or more as the healthy agency-wide range and 60 to 70% for single projects. Project margins run higher because idle time and shared tools pull the full P&L figure down. Mercury gives a wider band of 55 to 75%.
Keep delivery payroll and admin payroll in separate accounts. Without that split, delivery margin cannot be measured at all.
5. Overhead and client acquisition cost
Overhead covers administration, sales and marketing, and facilities. Both Parakeeto and Mercury put the total at roughly 20 to 30% of gross income. Parakeeto splits it into three bands. Administration runs 8 to 12%, sales and marketing 8 to 14%, and facilities 4 to 6%.
Three formulas turn overhead into growth decisions:
- Client acquisition cost (CAC) = sales and marketing spend divided by new clients won in the same period. Include the salaries of people who sell.
- Lifetime value (LTV) = monthly retainer x delivery margin, divided by monthly churn.
- Payback period = CAC divided by monthly delivery profit per client.
SaaS finance teams often target an LTV to CAC ratio of 3 to 1 and payback within 12 months. Agency models commonly borrow those targets.
6. Cash timing
Profit is an accounting figure. Cash pays salaries. A model built on 30-day payment terms hides a cash hole when clients pay at 60 days.
Add a rolling 13-week cash flow forecast next to the monthly model. It maps cash in and cash out week by week, so a payroll shortfall shows up two months early. Model what clients actually do, not what the contract says.
Worked example: a $50,000 per month agency
The figures below are illustrative. They are not client data. They show how the six numbers fit together.
| Line | Monthly amount | % of revenue |
| Retainer revenue | $44,000 | 88% |
| Project revenue | $6,000 | 12% |
| Total revenue | $50,000 | 100% |
| Delivery payroll | $19,000 | 38% |
| Freelancers | $4,000 | 8% |
| Delivery software | $1,000 | 2% |
| Delivery profit | $26,000 | 52% |
| Administration | $5,500 | 11% |
| Sales and marketing | $6,500 | 13% |
| Facilities | $2,500 | 5% |
| Net profit | $11,500 | 23% |
Delivery margin sits at 52% and overhead at 29%. Both fall inside the ranges above. Now stress the plan.
| Scenario | Revenue | Net profit | Net margin | What changes |
| Base case | $50,000 | $11,500 | 23% | Starting point |
| Lose one $5,000 retainer, team unchanged | $45,000 | $6,500 | 14% | Net profit falls by about 43% |
| Raise retainer prices 10%, no client lost | $54,400 | $15,900 | 29% | Net profit rises by about 38% |
| Clients pay 30 days later | $50,000 | $11,500 | 23% | $50,000 more cash tied up in invoices |
One lost client wipes out nearly half of profit because payroll does not shrink with revenue. A 10% price rise adds almost as much profit as the lost client removes. The late-payment row shows no change in profit. Yet it ties up more than four months of profit in unpaid invoices. This is why a profit forecast alone is never enough.
The unit economics follow from the same figures. A $5,000 retainer at 52% delivery margin yields $2,600 a month. At 4% monthly churn (about 39% of clients leaving each year), LTV is $65,000. If $6,500 of monthly sales and marketing wins one client every two months, CAC is $13,000. Payback takes five months and LTV to CAC is 5 to 1.
Benchmarks to test your model against
Sources define margins differently, so pick one definition and keep it. These ranges come from Parakeeto and Mercury.
| Metric | Typical range |
| Gross margin (after pass-through costs) | 50% or higher |
| Delivery margin, agency-wide | 50 to 75%, depending on the source |
| Delivery margin, single project | 60 to 70% or higher |
| Overhead | 20 to 30% of gross income |
| Net profit margin | 15 to 20% typical, 25 to 30% for strong agencies |
| Billable utilization | 70 to 80% |
An agency outside these ranges has learned where to look first. It has not necessarily failed.
How your pricing model changes the forecast
The same team earns different margins under different pricing. Test each model before offering it.
| Pricing model | Forecast strength | Main risk |
| Hourly | Flexible and easy to scale | Income is hard to predict |
| Monthly retainer | Steady, recurring cash | Scope creep erodes margin |
| Fixed fee | Clear price for the client | Delays and revisions cost the agency |
| Hybrid (retainer plus project) | Stability with room to grow | More complex to track |
Retainers dominate in most agencies because they make cash easier to forecast. They also make churn the number to watch.
Which model fits your digital business
Many readers searching for a digital marketing financial model plan a new venture, not an agency. The right model depends on how the business earns money.
| Business type | Main revenue driver | Model this first |
| Content marketing, SEO and social media agencies | Retainers and billable hours | Utilization and delivery margin |
| Video, graphic design and web design agencies | Fixed-fee projects and retainers | Project margin and scope creep |
| Mobile app development agency | Project and maintenance fees | Pipeline gaps between projects |
| Transcription services | Per-file or per-minute work | Labor cost per delivered hour |
| Dropshipping and e-commerce sites | Orders x average order value | Contribution margin and break-even ROAS |
| CMS, influencer marketing and customer engagement software | Subscriptions | Churn and CAC payback |
| Online freelancer platform | Commission on transactions | Take rate and cost to acquire both sides |
| Subscription and transactional video on demand | Subscriptions or per-title sales | Churn for subscriptions, revenue per title for rentals |
Oak Business Consultant maintains industry-specific financial model templates for most of these business types.
Modeling a campaign budget instead of an agency
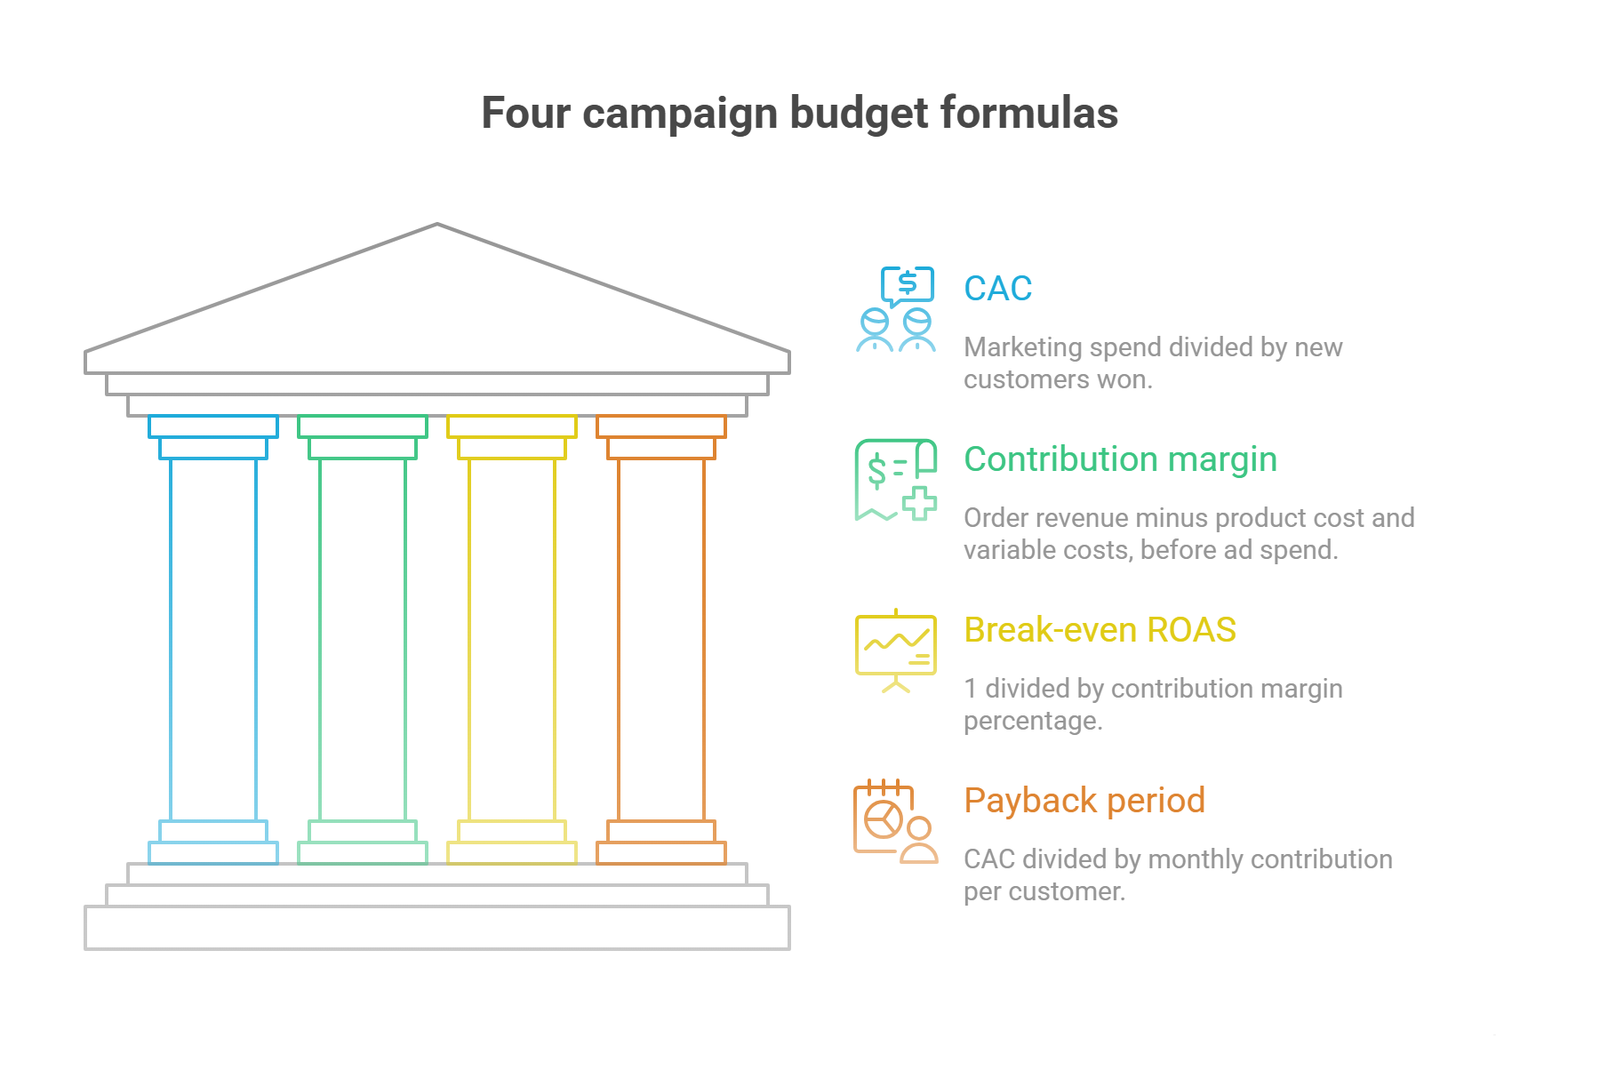
An in-house team or an e-commerce store models marketing spend, not agency overhead. Four formulas do most of the work.
- CAC = marketing spend divided by new customers won.
- Contribution margin = order revenue minus product cost and variable costs, before ad spend.
- Break-even ROAS = 1 divided by contribution margin percentage.
- Payback period = CAC divided by monthly contribution per customer.
A store with a 40% contribution margin needs a ROAS of 2.5 to break even on the first order. Below that, each ad dollar loses money until repeat purchases arrive. Model repeat purchase rate separately so a low first-order ROAS is a conscious bet, not an accident.
Common mistakes to avoid
- Counting a verbal yes as revenue. Forecast signed work only and treat the rest as upside.
- Leaving out hidden costs. Payroll taxes, benefits and paid leave can lower margin by several points.
- Mixing delivery and overhead payroll. One combined account makes margin impossible to read.
- Trusting contract terms over payment habits. Model the days clients actually take to pay.
- Building the model once. Compare forecast to actuals every month and fix the assumptions that missed.
Build the model in six steps
- List every signed contract with its start date, end date and monthly value.
- Add pipeline deals at a lower probability and a later start date.
- Split costs into delivery, overhead and pass-through.
- Set utilization, billing rates and hiring triggers.
- Add payment timing and a 13-week cash view.
- Save three versions: base, downside and stretch. Update them monthly.
Frequently Asked Questions
What is a digital marketing financial model?
It is a forecast of revenue, costs, profit and cash for a digital marketing business or campaign budget. It uses stated assumptions such as client count, churn, utilization and payment timing to project results over months or years.
Should the model be built in Excel or in software?
Excel suits small agencies that want control and low cost. The risk is a broken formula. Pre-built frameworks speed up setup but fit unusual service mixes poorly. Automation tools pull live data and flag margin slips, at a higher price.
How do I forecast revenue for a new agency with no clients?
Work from the bottom up. Estimate leads per month, proposal rate, close rate, average retainer and start delay. Then apply churn. Treat the result as a hypothesis and replace each assumption with real data as clients sign.
What is the difference between gross margin and delivery margin?
Gross margin removes pass-through costs such as media spend billed to clients. Delivery margin goes one step further and subtracts the internal labor and tools used to do the work. Delivery margin is the better test of agency efficiency.
How often should the model be updated?
Update actuals against forecast every month. Refresh the 13-week cash view every week. Revisit pricing and hiring assumptions once a quarter.
Make the model change a decision
A digital marketing financial model earns its place when it changes what the business does next. Think of a price raised before a hire or a client dropped before the quarter ends. Think of a payment term tightened before cash runs short. Start with the six numbers, keep every assumption visible and review the results monthly. The spreadsheet matters less than the habit of asking what happens if.
Oak Business Consultant builds custom marketing agency financial models. They forecast revenue, margin and cash for retainer, project and hybrid agencies. Book a free consultation to review your numbers with a financial modeling specialist. For a ready-made starting point, see the social media marketing agency Excel financial model.