Direct Cost Breakdown Analysis: A Complete Guide
Essential Direct Cost Breakdown Analysis Tips
Every dollar that leaves your business tells a story. The question is whether you are reading it.
A direct cost breakdown analysis is one of the most powerful tools a business can use to understand where money actually goes. Not where you think it goes. Where it actually goes. When you break costs down by their true components, you stop guessing and start making decisions based on real numbers.
This guide walks you through everything you need to know about conducting a thorough direct cost breakdown analysis, from the core concepts to the methods that help you control spending and protect your margins.
What Is a Direct Cost Breakdown Analysis?
A direct cost breakdown analysis is the process of identifying, categorizing, and examining every cost that can be directly tied to a specific product, service, project, or business unit. Unlike indirect costs or overhead, direct costs move in direct proportion to what you produce or deliver.
The goal is clarity. When you run a proper cost breakdown analysis, you get a line-by-line view of your cost structure. You can see which cost elements are eating into your margins, where resource allocation can be improved, and which cost drivers are most sensitive to change.
This type of analysis is used across industries, from manufacturing and construction to professional services and tech. Wherever money flows into producing an output, a direct cost breakdown analysis helps you understand and manage that flow.
Why Direct Costs Matter More Than People Think
Many businesses focus on revenue growth while paying less attention to what it costs to generate that revenue. This is a costly mistake.
Labor costs and material costs are typically the two largest direct cost components for most businesses. Together, they often represent 60 to 80 percent of total production costs. Small inefficiencies in either area compound quickly at scale.
Here is a simple truth: a 5 percent reduction in direct costs can have a greater impact on net profit than a 20 percent increase in revenue in many business models. That is why a focused direct cost breakdown analysis pays for itself many times over.
Understanding your cost breakdown structure also makes you better prepared for supply chain disruptions, price increases in raw materials, or sudden changes in labor market conditions. Businesses that know their numbers in detail respond faster and smarter.
The Core Components of a Direct Cost Breakdown
When you conduct a direct cost breakdown analysis, you are examining specific cost elements that contribute to your output. Here is what that typically includes.
Labor Costs
Labor costs represent the wages, salaries, benefits, and payroll taxes tied to the people directly involved in producing your product or delivering your service. In manufacturing, this means your production floor workers. In consulting, it means the hours your team spends on client deliverables.
Labor costs are often the most visible direct cost, and also the hardest to optimize without the right data. A good cost breakdown analysis will show you not just total labor spend, but labor cost per unit, per project, or per service hour.
Material Costs
Material costs cover everything you purchase to create your product. Raw materials, components, packaging, and manufacturing supplies all fall into this category. For a manufacturer, this includes raw materials like steel, plastic, or fabric. For a food business, it includes ingredients and packaging like recycled corrugated board.
Tracking material costs at a granular level allows you to spot price creep before it damages margins. It also gives you leverage in supplier negotiations because you can see exactly where you are spending and how costs have shifted over time.
Overhead Costs Allocated to Direct Production
While overhead costs like rent expenses, utility expenses, and administrative salaries are not always classified as direct costs, a portion of them can be allocated to specific products or projects based on a cost allocation basis. Understanding how these costs flow into your cost breakdown structure gives you a more accurate picture of true profitability.
Contingency Costs
Contingency costs are planned buffers built into cost estimates to account for uncertainty. In project management, contingency is typically set as a percentage of the total estimated cost, adjusted for the level of risk in the project.
A thoughtful cost breakdown analysis will flag whether contingency reserves are being used appropriately or are masking deeper cost problems.
How to Conduct a Direct Cost Breakdown Analysis
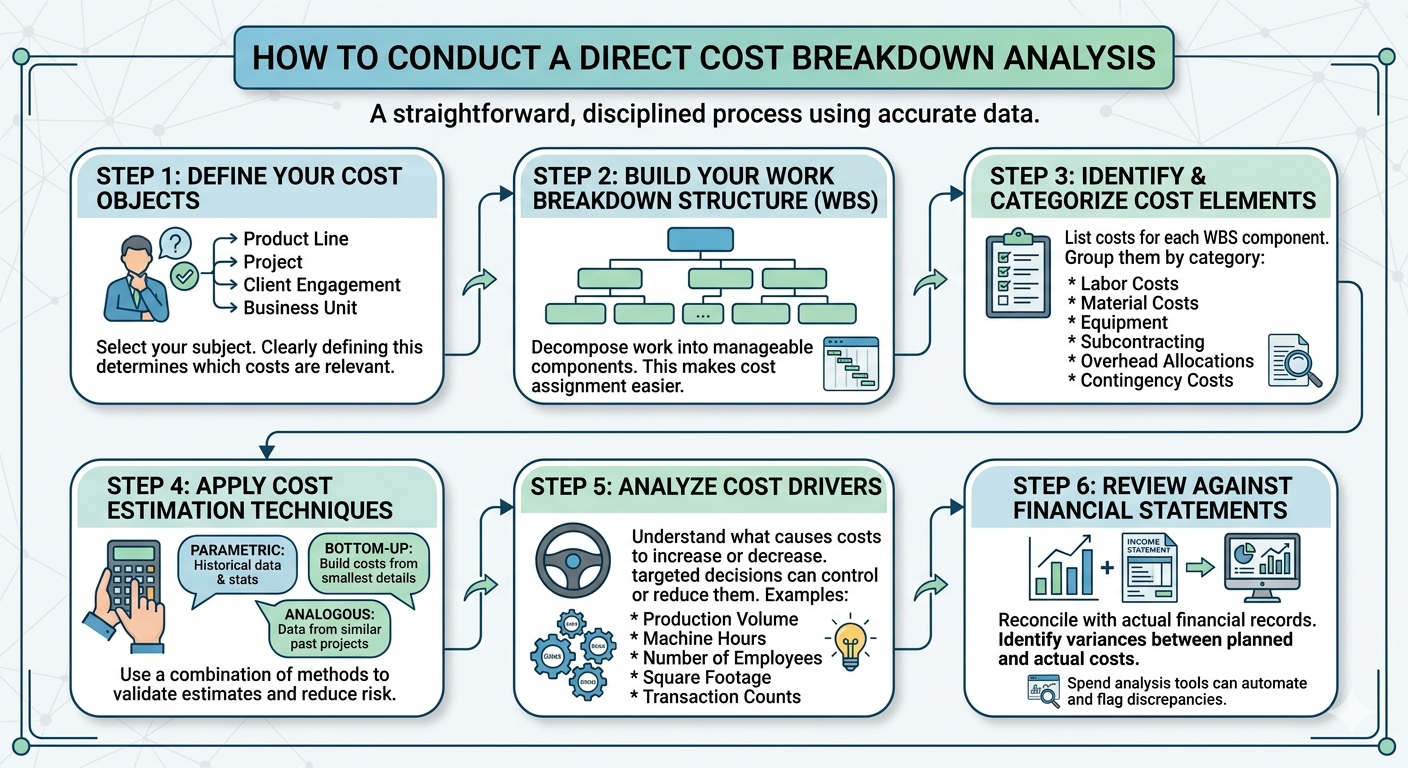
The process is straightforward but requires discipline and accurate data. Here are the key steps.
Step 1: Define Your Cost Objects
A cost object is whatever you are analyzing. It could be a product line, a project, a client engagement, or a business unit. You need to define this clearly before you start, because it determines what costs are relevant and which are not.
Step 2: Build Your Work Breakdown Structure
A work breakdown structure (WBS) is a hierarchical decomposition of the work required to deliver your cost object. It breaks the project or product down into manageable components, making it easier to assign costs at each level.
This step is critical in project management contexts. Tools like MS Project or other project management software can help you build and track a WBS efficiently. Gantt charts can provide a visual layer that helps your support team understand the timeline and cost flow together.
Step 3: Identify and Categorize Cost Elements
For each component in your work breakdown structure, list the cost elements that apply. Group them by category: labor costs, material costs, equipment, subcontracting, overhead allocations, and contingency costs.
Being thorough here is what separates a useful cost breakdown analysis from a superficial one. Every cost element should be traceable back to a source document or a verifiable estimate.
Step 4: Apply Cost Estimation Techniques
Depending on the nature of your project or product, you may use several cost estimation techniques. Parametric estimating uses statistical relationships between historical data and project variables to generate cost estimates. Bottom-up estimating builds costs from the smallest components upward. Analogous estimating uses data from similar past projects as a reference.
Each method has its strengths. Many finance teams use a combination to validate their cost estimates and reduce the risk of significant surprises during execution.
Step 5: Analyze Cost Drivers
Cost drivers are the activities or conditions that cause costs to increase or decrease. Understanding your cost drivers is one of the most valuable outcomes of a thorough direct cost breakdown analysis.
Common cost drivers include production volume, number of employees, machine hours, square footage, and transaction counts. When you know what is driving your costs, you can make targeted decisions to control or reduce them.
Step 6: Review Against Financial Statements
Your cost breakdown analysis should be reconciled against your actual financial statements. This helps you identify variances between planned and actual costs, catch cost spikes early, and verify that your cost allocation basis is producing accurate results.
Spend analysis tools can automate much of this reconciliation, flagging discrepancies and trends that might otherwise take hours to find manually.
Cost Control and Cost Reduction Strategies
A direct cost breakdown analysis is not just a diagnostic tool. It is a roadmap for cost control and cost reduction.
Once you understand your cost structure in detail, you can pursue specific strategies. Renegotiating supplier contracts becomes more effective when you have granular data on material costs and market benchmarks. Adjusting labor deployment becomes easier when you can see exactly where labor hours are being consumed relative to output.
Cost objectives should be set based on what the analysis reveals, not on arbitrary targets. Cost savings goals that are grounded in real cost data are far more achievable and sustainable than those pulled from thin air.
Earned Value Management (EVM) is one framework that combines cost and schedule performance into a unified view. EVM metrics like the Cost Performance Index and Schedule Performance Index give project teams a real-time signal of whether they are on track to deliver within budget. This is especially valuable in complex projects where cost relationships between tasks can shift quickly.
In supply chain contexts, a cost breakdown analysis can reveal opportunities to streamline supply chain management, consolidate suppliers, reduce procurement costs, or shift toward more cost-effective raw materials without compromising quality.
Cost Breakdown Analysis in Government Contracting
In government contracting, a direct cost breakdown analysis takes on additional legal and regulatory significance. The Federal Acquisition Regulation (FAR), specifically FAR 15.404-1(c), requires contractors to provide detailed cost or pricing data when contracts exceed certain thresholds.
A contracting officer will review the cost breakdown structure to assess whether proposed costs are fair and reasonable. This includes scrutiny of labor rates, material costs, overhead allocations, and contingency reserves.
Contractor Cost Data Reports submitted to the Cost Assessment Data Enterprise (CADE) are one mechanism through which government agencies collect and analyze contractor cost data over a project lifecycle. Understanding how to structure your cost breakdown analysis in accordance with these reporting requirements can protect you during audits and support equitable adjustments when circumstances change.
When a suspension of work or a differing site condition affects project costs, having a rigorous cost breakdown already in place makes it far easier to calculate and justify the equitable adjustment you are entitled to. Proposal preparation costs in these situations also need to be tracked and justified, and a detailed cost breakdown structure is your best defense.
Using Technology to Improve Your Cost Breakdown Analysis
Modern businesses have more tools available than ever to support accurate and efficient cost breakdown analysis.
Project management software makes it easier to build and maintain a work breakdown structure, track actual costs against cost estimates, and generate real-time variance reports. Platforms like MS Project and others integrate with financial systems so that cost data flows automatically rather than being entered manually.
Digital twins, a newer technology, allow organizations to simulate cost scenarios before committing to them. By modeling different resource allocation decisions or supply chain configurations, you can test the impact on your cost breakdown structure before spending a dollar.
AI-powered procurement tools are also changing how organizations manage material costs and supply chains. AI procurement platforms can analyze spending patterns across thousands of transactions, identifying opportunities for consolidation, better pricing, or improved vendor terms. This kind of intelligence would take a team of analysts months to generate manually.
Spend analysis platforms sit at the intersection of procurement and finance, giving leadership a unified view of where money is going across the organization. This connects directly to a more accurate and actionable direct cost breakdown analysis.
Common Mistakes to Avoid
Even experienced finance teams make mistakes in cost breakdown analysis. Here are the most common ones.
Confusing direct and indirect costs is a foundational error. Misclassifying costs distorts your understanding of true product or project economics.
Ignoring cost drivers beyond volume is another common problem. Many teams assume that costs scale linearly with output. In reality, costs have complex relationships that only become visible when you examine the data carefully.
Failing to update cost estimates as a project progresses is a project management failure that can lead to unpleasant surprises at completion. Cost estimates are living documents that should be revised as new information becomes available.
Treating contingency costs as a piggy bank rather than a managed reserve leads to budget overruns that look unforeseeable but were actually preventable.
Finally, not aligning cost objectives with strategic goals means that even a perfect cost breakdown analysis may not drive the right decisions.
Frequently Asked Questions
What is the difference between a cost breakdown and a cost estimate?
A cost estimate is a projection of what something will cost before it happens. A cost breakdown analysis dissects actual or projected costs into their component parts so you can understand the structure, not just the total. The two are related but serve different purposes.
How often should a business conduct a direct cost breakdown analysis?
For ongoing operations, a quarterly review is a good baseline. For active projects, it should be done monthly or at key project milestones. Any time there is a significant change in market conditions, supplier pricing, or operational structure, it is worth revisiting.
How does a direct cost breakdown analysis support cost reduction?
By revealing exactly where money is being spent and what is driving those costs, a direct cost breakdown analysis makes it possible to target cost reduction efforts precisely. Instead of cutting broadly, you can focus on the cost elements with the highest impact and the most room for improvement. A structured project budget template can help you compare estimates against actuals in real time.
Is a direct cost breakdown analysis useful for small businesses?
Absolutely. In fact, small businesses often benefit most because they have fewer resources to absorb inefficiencies. Understanding your cost drivers and cost elements clearly is even more critical when margins are tight and cash flow matters deeply.
What is the Cost Performance Index in Earned Value Management?
The Cost Performance Index (CPI) is a ratio of earned value to actual cost. A CPI above 1.0 means you are getting more value per dollar spent than planned. Below 1.0 means you are over budget relative to work completed. It is one of the most useful EVM metrics for monitoring project cost health.
Conclusion
A direct cost breakdown analysis transforms vague financial concern into specific, actionable intelligence. It shows you exactly where your money goes, what is driving your costs, and where the real opportunities for savings and efficiency live.
Most businesses have more cost optimization potential than they realize. The challenge is not finding the savings. It is having the analytical clarity to see them.
If your business is ready to move from reactive cost management to proactive financial strategy, working with an experienced CFO can accelerate that journey significantly. Oak Business Consultant offers CFO services designed to help growth-stage businesses build the financial systems, cost frameworks, and strategic clarity needed to compete and scale. Reach out to explore how their team can help you turn your cost data into a competitive advantage.