


Graphic Designing Excel Financial Model


Original price was: $350.$210Current price is: $210.
The Financial Analysts at Oak Business Consultant have made this complete and dynamic Graphic Design Excel Financial Model Template for your total financial planning needs. The model has a 5-year financial projection plan to track steady growth and profitability. It can also estimate ongoing operating expenses, monthly sales revenue, startup investment requirements, and inventory. With this easy-to-use template, there is no further need for complex calculation, you need to add numbers, and you are all set.
Frequently Bought Together
- Description
- Reviews (12)
Description
Strategic Financial Modeling Framework for your Graphic Designing Business
In the dynamic world of graphic designing agencies, strategic financial planning is paramount for success and sustainability. One powerful tool that aids in this endeavor is the Graphic Designing Excel Financial Model. This comprehensive tool offers insights, analysis, and forecasting capabilities tailored specifically to the unique needs of graphic agencies. By harnessing the power of this financial model, agencies can make informed decisions, optimize resource allocation, and drive profitability. Let’s explore how to effectively utilize the Financial Model to unlock the full potential of your designing agency’s financial management.
Oak Business Consultant specializes in bespoke services, tailored to your specific needs. We offer personalized business plans, pitch decks, and financial models. Our focus on individuality sets us apart in the industry. We prioritize your satisfaction and look forward to proving our commitment. Moreover, our experienced business and financial experts are ready to refine your financial model, pitch deck, or business plan. We can customize these essential tools to meet your precise requirements, ensuring the end product exceeds your expectations.
Utilizing the Graphic Designing Excel Financial Model
The Graphic Designing Excel Financial Model serves as a cornerstone for financial planning and analysis within graphic design agencies. Its robust features and customizable framework empower agencies to navigate complex financial landscapes with confidence. Here’s a closer look at the key components of this indispensable tool:
Key Components
The following are the key components of this Excel Financial Model Template:
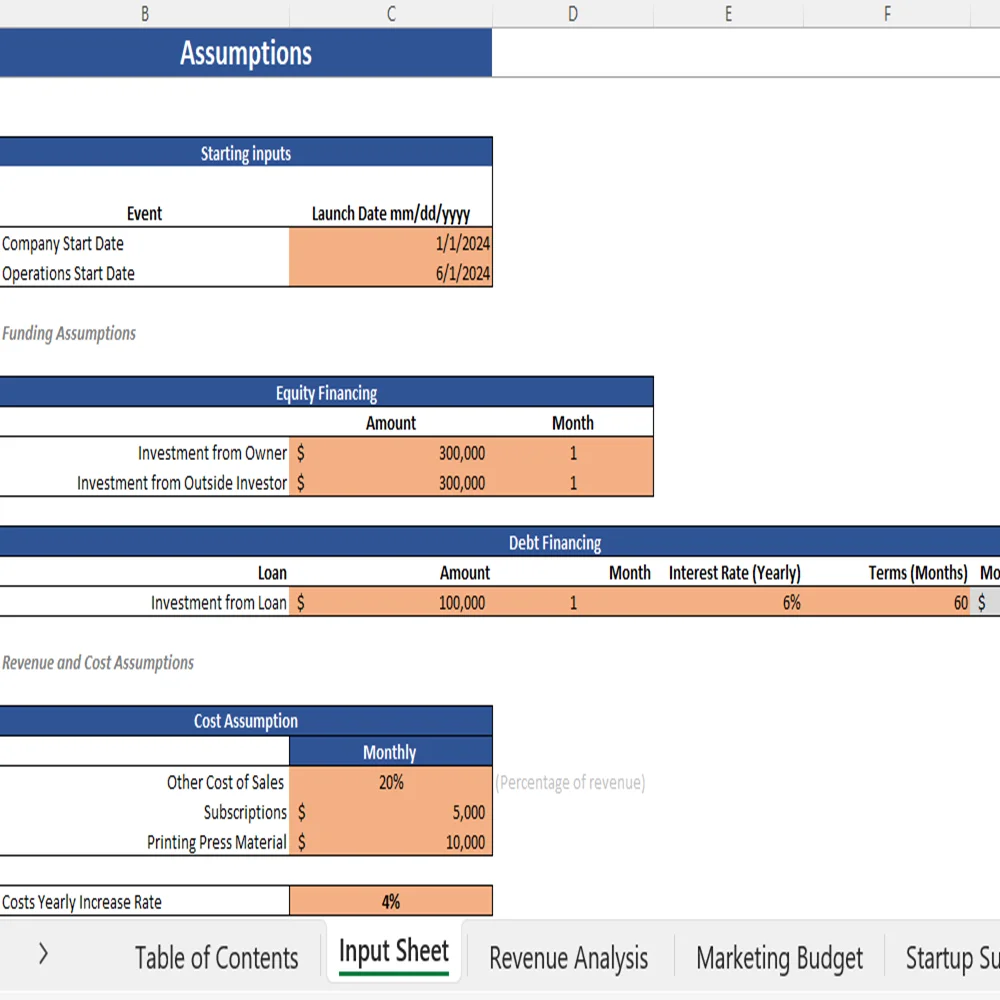
Input Sheet:
The Input Sheet acts as the starting point, allowing users to input key assumptions, parameters, and variables that drive financial projections. This includes revenue drivers, cost structures, pricing strategies, growth projections, and other pertinent data points.
Revenue Analysis:
The Revenue Analysis section provides a comprehensive overview of revenue streams, enabling agencies to assess the performance of different service offerings. Moreover, it also provides pricing models and client segments. By analyzing revenue trends and identifying opportunities for growth, agencies can optimize their revenue generation strategies.

Marketing Budget:
Effective marketing is essential for attracting clients and driving business growth. The Marketing Budget component of the financial model helps agencies plan and allocate resources for marketing initiatives. Moreover, it aslo ensures optimal ROI and visibility within the target market.

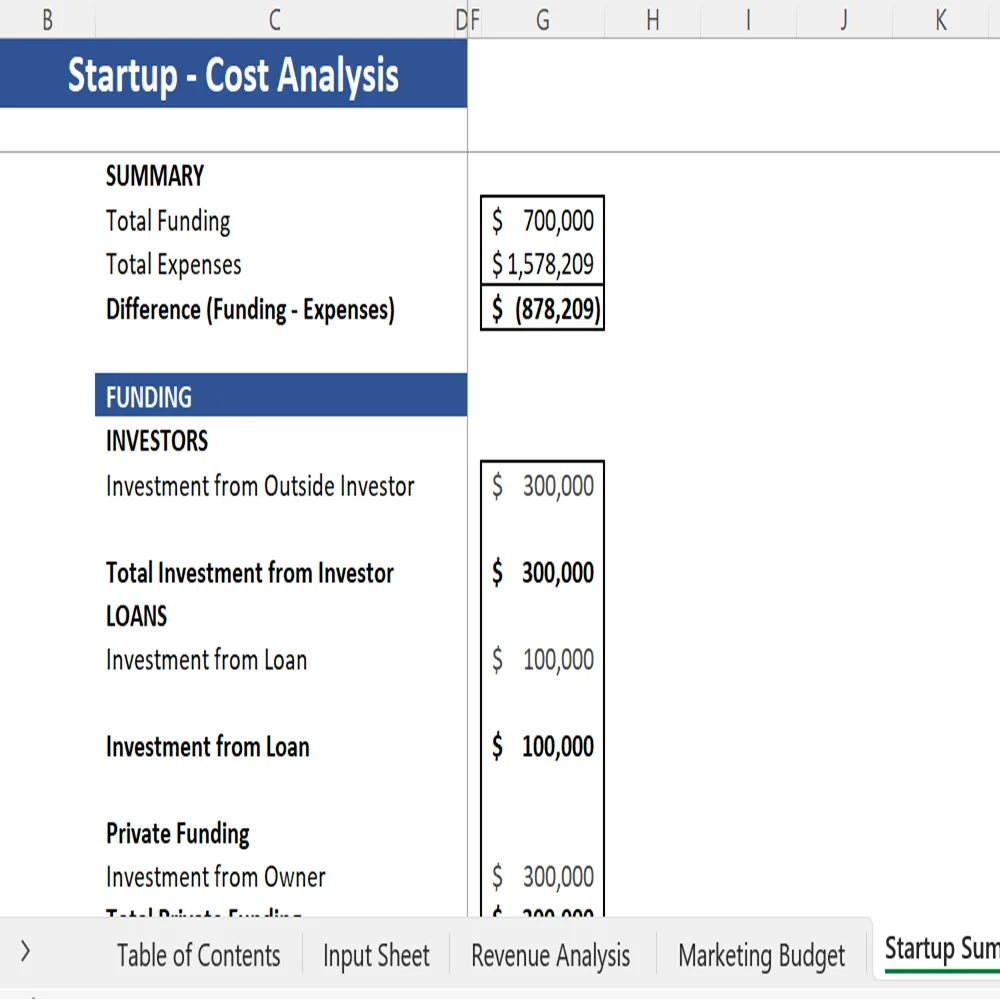
Startup Summary:
For new agencies or startups, the Startup Summary section outlines the initial investment required to launch the business. This includes startup costs, equipment purchases, marketing expenses, and working capital needs, providing a clear roadmap for financial planning.
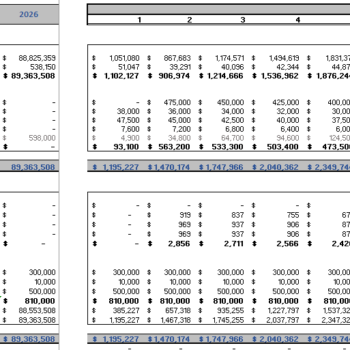
Income Statement:
The Income Statement offers a detailed breakdown of revenues, expenses, and net income over a specified period. It provides insights into the agency’s financial performance, profitability, and operational efficiency, facilitating informed decision-making.

Cashflow Statement:
Cash is king in any business, and the Cashflow Statement helps agencies manage cash inflows and outflows effectively. By tracking cash flow projections, including accounts receivable and accounts payable, agencies can ensure liquidity and financial stability.

Balance Sheet:
The Balance Sheet provides a snapshot of the agency’s financial position at a specific point in time, detailing assets, liabilities, and equity. It offers insights into the agency’s solvency, leverage, and overall financial health.

Break-even Analysis:
The Break-even Analysis calculates the level of sales needed to cover fixed costs and achieve a zero-profit scenario. It helps agencies determine their break-even point and assess the viability of different business strategies.

Company Evaluation:
The Company Evaluation section includes financial metrics and ratios used to evaluate the agency’s performance, such as profitability ratios, liquidity ratios, and efficiency ratios. It enables stakeholders to assess the agency’s financial health and make informed investment decisions.

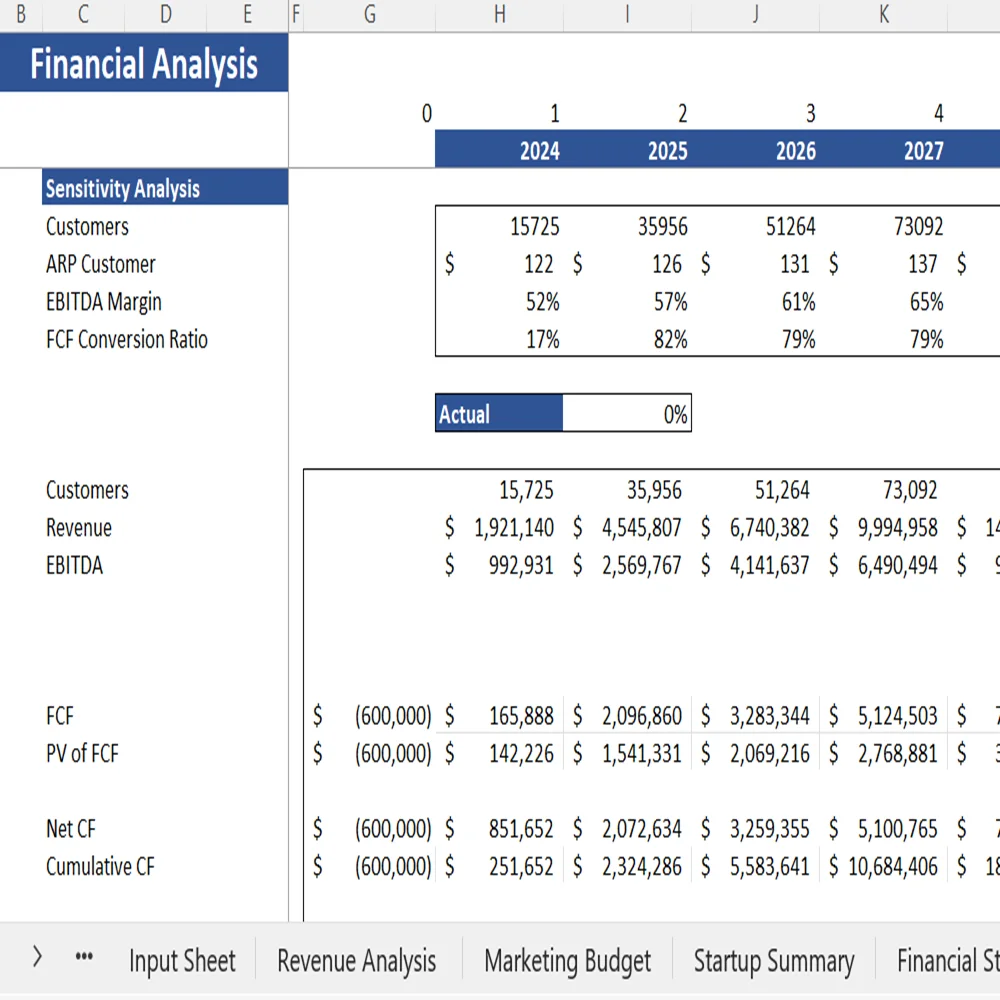
Sensitivity Analysis:
Sensitivity Analysis evaluates the impact of changes in key variables on financial projections. By testing different scenarios and adjusting input parameters, agencies can identify potential risks and opportunities. It helps in enhancing decision-making under uncertainty.
KPIs and Ratios:
Key Performance Indicators (KPIs) and financial ratios provide valuable insights into the agency’s operational and financial performance. By tracking metrics such as profit margins, return on investment, and cash flow ratios, agencies can measure progress towards strategic goals and identify areas for improvement.

CAC-CLV Analysis:
Customer Acquisition Cost (CAC) and Customer Lifetime Value (CLV) analysis helps agencies optimize their marketing and client acquisition strategies. By comparing the cost of acquiring a customer to the lifetime value of that customer, agencies can make data-driven decisions to maximize profitability and ROI.

Working Sheet:
The Working Sheet serves as a central hub for financial modeling, allowing users to perform complex calculations, scenario analysis, and data manipulation. Its flexible design enables agencies to customize the model to suit their specific needs and objectives.

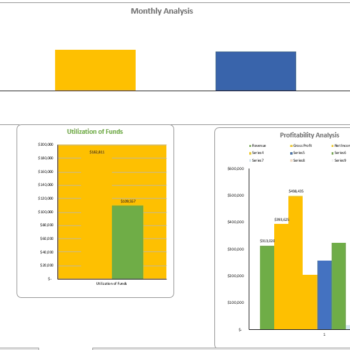
Dashboard:
The Dashboard provides a visual representation of key financial metrics and performance indicators, offering stakeholders a clear and intuitive overview of the agency’s financial health and performance.

Frequently Asked Questions
What are the key assumptions driving revenue projections in the Excel financial model for our graphic designing?
The revenue projections in the Excel financial model are driven by key assumptions such as client acquisition rates, project pipelines, pricing strategies, and market demand for graphic design services. Moreover, these assumptions are based on market research, historical data, industry trends, and insights from industry experts.
How does the Excel financial model account for seasonality or fluctuations in demand for graphic design services?
The Excel financial model incorporates seasonality factors and demand fluctuations by analyzing historical data and adjusting revenue projections accordingly. Furthermore, it considers peak seasons, industry cycles, and other external factors that may impact the agency’s revenue streams.
Can the Excel financial model accommodate different pricing structures for our graphic design services, such as hourly rates versus project-based fees?
Yes, the Excel financial model is customizable to accommodate various pricing structures for graphic design services. Moreover, it allows agencies to input different pricing models, such as hourly rates, fixed project fees, retainer agreements, or a combination of these approaches, and assess the impact on revenue projections and profitability.
How does the Excel financial model account for variable costs, such as subcontractor fees or material costs, in our graphic design projects?
The Excel financial model incorporates variable costs by allowing agencies to input cost estimates for subcontractor fees, material costs, and other project-related expenses. Furthermore, it calculates total variable costs based on project volumes and provides insights into cost margins and profitability.
What metrics or key performance indicators (KPIs) are calculated in the Excel financial model to assess the profitability and performance of our graphic designing?
The Excel financial model calculates various KPIs and financial metrics to assess the profitability and performance of graphic designing, including gross profit margins, net profit margins, return on investment (ROI), return on assets (ROA), return on equity (ROE), and others. Moreover, these metrics provide insights into the agency’s financial health and efficiency.
How does the Excel financial model handle cash flow projections, including accounts receivable and accounts payable, to ensure liquidity for our graphic designing?
The Excel financial model incorporates cash flow projections, including accounts receivable and accounts payable, to ensure liquidity for graphic designing. Furthermore, it tracks cash inflows from client payments and cash outflows for expenses, allowing agencies to monitor cash balances, manage working capital, and plan for future cash needs.
Can the Excel financial model perform sensitivity analysis to assess the impact of changes in key variables, such as client acquisition costs or project margins, on our financial projections?
Yes, the Excel financial model can perform sensitivity analysis to assess the impact of changes in key variables on financial projections. Moreover, it allows agencies to test different scenarios, adjust input parameters, and analyze the sensitivity of financial outcomes to changes in variables such as client acquisition costs, project margins, pricing strategies, and market conditions.
Does the Excel financial model incorporate scenarios for different growth trajectories or expansion plans for our graphic designing?
Yes, the Excel financial model incorporates scenarios for different growth trajectories and expansion plans for graphic designing. Furthermore, it allows agencies to input growth assumptions, such as revenue growth rates, expansion costs, and investment timelines, and assess the financial impact of different growth scenarios on profitability, cash flow, and financial performance.
How customizable is the Excel financial model to accommodate specific requirements or unique aspects of our graphic designing business model and operations?
The Excel financial model is highly customizable to accommodate specific requirements or unique aspects of the graphic design’s business model and operations. Moreover, it allows agencies to customize input parameters, adjust formulas, add new variables, and tailor financial projections to reflect the agency’s unique characteristics, market dynamics, and strategic objectives.
What level of detail does the Excel financial model provide in terms of financial statements (income statement, balance sheet, cash flow statement) and other financial reports for our graphic designing stakeholders?
The Excel financial model provides a high level of detail in terms of financial statements, including income statements, balance sheets, and cash flow statements. Moreover, it also highlights other financial reports for the graphic designing stakeholders. It presents financial data in a clear and organized format, allowing stakeholders to analyze trends, make informed decisions, and communicate financial performance effectively.
Conclusion
In conclusion, the Graphic Designing Excel Financial Model is a powerful tool that empowers graphic design agencies to make informed financial decisions, optimize resource allocation, and drive profitability. By leveraging its key components, conducting a thorough analysis, and addressing frequently asked questions, agencies can unlock the full potential of their financial management and propel their business toward success in a competitive market landscape.
Walk-Through Video of Graphic Designing Excel Financial Model
The following video will give you an overview of the different components of the financial model and will help you understand it works.
12 reviews for Graphic Designing Excel Financial Model
Add a review
You must be logged in to post a review.


Bertha –
I am blown how beautifully this model make things so easy. Great work by Oak.
Paul Weber –
This financial model not only meets but exceeds industry standards. Its comprehensive approach to financial planning is unmatched, making it an essential tool for any graphic design business.
Brandon Scott –
The integration capabilities with other software tools have streamlined our workflow, making financial management more cohesive and less time-consuming.
Jeffrey Hill –
Adopting this model has significantly improved our financial discipline and accountability. It’s a cornerstone of our business strategy now.
Kevin Hall –
The model’s robustness and adaptability make it a perfect fit for both small studios and large agencies. It’s a versatile tool that grows with your business.
Jacob Williams –
For graphic design startups, this model is a must-have. It demystifies financial planning and sets a solid foundation for growth.
Louis Martin –
I was particularly impressed by the scenario planning capabilities of this model. It enables us to prepare for various business situations, ensuring resilience and adaptability.
Matt Lewis –
The model’s user-friendly interface and customizable features have made financial management a breeze for our design team. It’s an invaluable tool for businesses of any size.
Charles White –
Efficiency at its best! This Excel Financial Model cuts down on manual data entry and errors, allowing more time for creative and strategic work.
Brian Harris –
This model has revolutionized how we approach our financial strategy. It’s tailored to the unique needs of graphic designers, providing clarity and confidence in our financial future.
Oliver Smith –
The attention to detail in this Excel model is impressive. It offers a deep dive into financial health, enabling graphic design firms to make informed decisions swiftly.
Harry Jones –
The Financial Model is a game-changer for creative businesses. Its intuitive design and comprehensive financial metrics provide unparalleled insights into our operations.