What Are Financial Ratios?
Financial Ratios 101: What They Are and Why They Matter
If you want to understand the true health of a business, numbers on a balance sheet alone will not tell you the full story. Financial ratios turn raw data from your financial statements into clear, actionable signals. They show you what is working, what is not, and where you need to act fast.
This guide breaks down what financial ratios are, the main types, how to use them, and why every business leader should make ratio analysis a regular habit.
What Are Financial Ratios?
Financial ratios are calculations that compare two or more numbers from your financial statements. These statements include the income statement, balance sheet, and statement of cash flows. When you divide one figure by another, you get a ratio that reveals how a company is performing in a specific area.
For example, dividing current assets by current liabilities gives you the current ratio. That one number tells you whether a business can cover its short-term obligations. Simple, but powerful.
Financial ratios are used by investors, lenders, managers, and analysts to evaluate financial health, compare businesses, spot trends, and make better decisions.
Why Financial Ratios Matter
Raw numbers are hard to interpret on their own. A company with $10 million in revenue sounds strong, but if it has $12 million in expenses, it is losing money fast. Ratios give context.
They help you:
- Answer whether the business can pay its bills this month (liquidity ratios)
- See how efficiently assets are being used (efficiency ratios)
- Understand how much debt is being carried (leverage ratios)
- Measure how much profit is being generated (profitability ratios)
- Compare performance against industry benchmarks or competitors
- Track changes over time through trend analysis
Without ratio analysis, financial statement analysis is incomplete. With it, you gain a much sharper picture of where a business stands.
The Main Categories of Financial Ratios
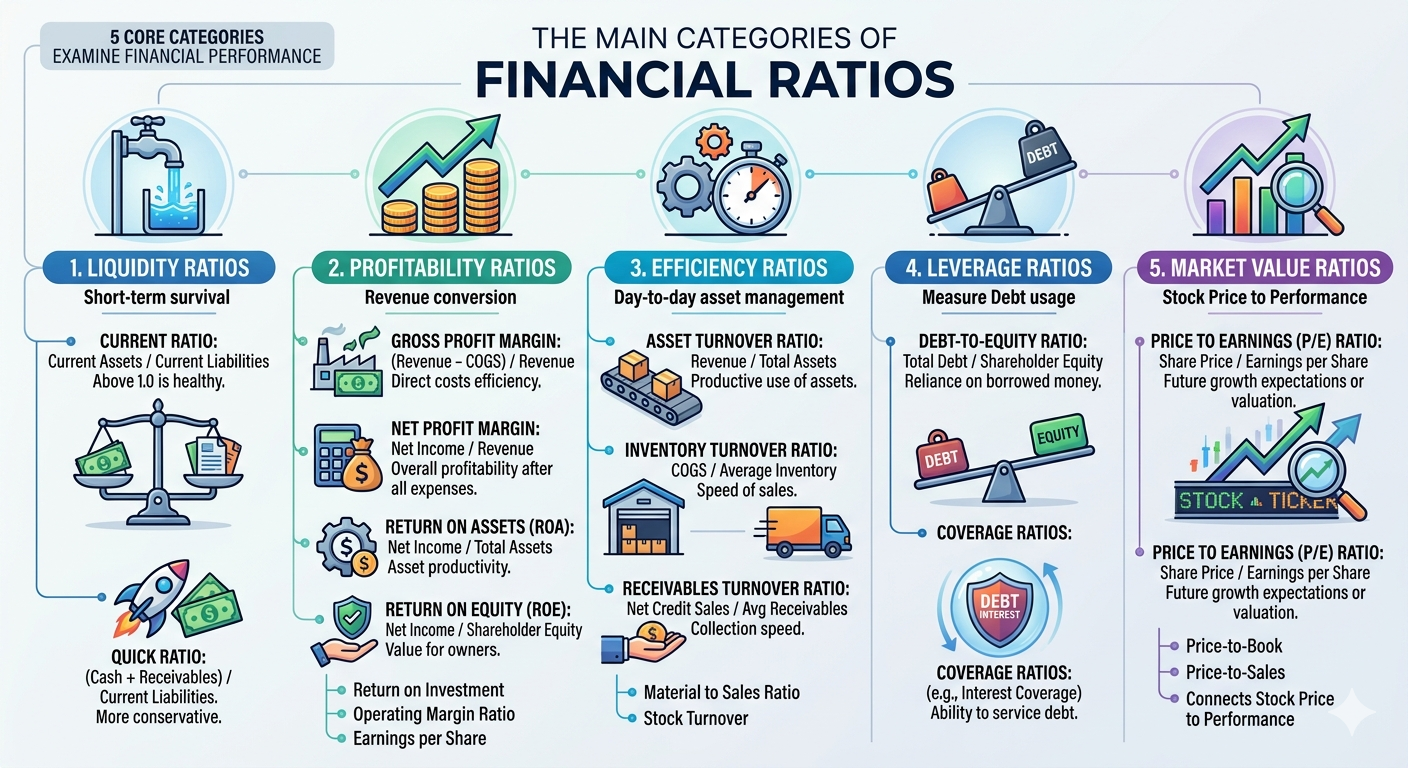
There are five core categories. Each one examines a different dimension of financial performance.
1. Liquidity Ratios
Liquidity ratios measure whether a company has enough short-term assets to cover short-term liabilities. They are the first test of financial survival.
Current Ratio
This is one of the most widely used liquidity ratios. The formula is:
Current Ratio = Total Current Assets / Total Current Liabilities
A current ratio above 1.0 means the business has more assets than liabilities due in the near term. A ratio below 1.0 is a warning sign.
Quick Ratio
The quick ratio is more conservative than the current ratio. It removes inventory from the equation since inventory is not always easy to convert to cash quickly.
Quick Ratio = (Cash + Receivables) / Current Liabilities
If the quick ratio is strong but the current ratio is weak, inventory may be dragging down liquidity.
Working Capital
Working capital is not a ratio in the traditional sense, but it is closely related. It tells you the actual dollar difference between current assets and current liabilities. Positive working capital means the business is operationally stable. The working capital ratio is another way to express this relationship as a number.
2. Profitability Ratios
Profitability ratios show how well a company converts revenue into profit. These are among the most important financial ratios for investors and owners alike.
Gross Profit Margin
This ratio measures how much money is left after paying the direct costs of producing goods or services.
Gross Profit Margin = (Revenue – Cost of Goods Sold) / Revenue
A high gross profit margin means the core business model is efficient.
Net Profit Margin
It goes further by accounting for all expenses, not just production costs.
Net Profit Margin = Net Income / Revenue
This ratio tells you what percentage of revenue actually becomes profit. A shrinking net profit margin over time is a red flag worth investigating.
Return on Assets
Return on assets (ROA) measures how efficiently a company uses its assets to generate profit.
ROA = Net Income / Total Assets
A strong return on assets ratio means the company is squeezing good value out of what it owns.
Return on Equity
Return on equity (ROE) is important for shareholders. It measures how much profit is generated relative to shareholder equity.
Return on Equity = Net Income / Shareholders Equity
Strong return on equity signals that management is creating value for owners.
Return on Investment
Return on investment is broader and can apply to specific projects or the business overall. It compares the gain from an investment to its cost.
Operating Margin Ratio
The operating margin ratio sits between gross profit margin and net profit margin. It captures profitability after operating expenses but before interest and taxes. It is a useful measure of core operational efficiency.
Earnings per Share
Earnings per share (EPS) is mostly used for publicly traded companies. It divides net income by the number of outstanding shares. Higher earnings per share generally signals stronger financial performance.
3. Efficiency Ratios
Efficiency ratios, also called activity ratios, show how well a company manages its assets and liabilities in day-to-day operations.
Asset Turnover Ratio
The asset turnover ratio measures how much revenue is generated for every dollar of assets.
Asset Turnover Ratio = Revenue / Total Assets
A higher ratio means assets are being used productively. A low ratio might indicate over-investment in assets or weak sales.
Inventory Turnover Ratio
The inventory turnover ratio shows how many times inventory is sold and replaced over a period.
Inventory Turnover Ratio = Cost of Goods Sold / Average Inventory
A high inventory turnover is generally positive. It means products are moving. A low inventory turnover can point to slow sales or excess stock.
Receivables Turnover Ratio
This ratio measures how efficiently a company collects on credit sales.
Receivables Turnover Ratio = Net Credit Sales / Average Accounts Receivable
A low receivables turnover can signal collection problems and cash flow risk. Average days receivable is a related metric that converts this ratio into an average number of days to collect payment.
Material to Sales Ratio
This lesser-known efficiency ratio compares material costs to total sales. It helps manufacturers and product businesses understand whether raw material spending is proportionate to revenue.
Stock Turnover
Stock turnover is similar to inventory turnover and is commonly used in retail. It tracks how quickly merchandise moves off shelves and gets replaced.
4. Leverage Ratios
Leverage ratios measure how much debt a company is using to finance its operations. They are also called debt ratios or financial leverage ratios. High leverage can amplify returns but also magnifies risk.
Debt-to-Equity Ratio
The debt-to-equity ratio compares total debt to shareholder equity.
Debt to Equity Ratio = Total Debt / Shareholders Equity
A high debt-to-equity ratio means the business relies heavily on borrowed money. Whether that is good or bad depends on the industry and how the debt is being used.
Coverage Ratios
Coverage ratios measure a company’s ability to service its debt. The interest coverage ratio is the most common. It divides operating income by interest expense. A ratio below 1.5 suggests the business might struggle to meet interest payments.
5. Market Value Ratios
Market value ratios are mainly used for publicly listed companies. They connect stock price to underlying financial performance.
Price to Earnings Ratio
The price to earnings ratio (PE ratio) compares share price to earnings per share.
PE Ratio = Share Price / Earnings per Share
A high PE ratio might mean the market expects strong future growth. A low PE ratio could signal undervaluation or weak prospects.
Market Ratios in Context
Other market ratios include price-to-book and price-to-sales. Together these stock valuation metrics help investors decide whether a stock is fairly priced. They are a key part of financial analysis for publicly traded businesses.
How to Use Financial Ratios Effectively
Knowing the formulas is one thing. Using ratios well is another.
Here is how to get the most from ratio analysis:
- Compare against benchmarks. A current ratio of 1.5 means little without context. Compare it to industry averages or competitors.
- Track trends over time. A single snapshot is useful. A series of ratios over 12 to 24 months is far more revealing. Trend analysis shows whether financial health is improving or declining.
- Use multiple ratios together. No single ratio tells the whole story. Combine liquidity ratios, profitability ratios, and efficiency ratios for a complete financial picture.
- Use reliable source data. Ratios are only as accurate as the financial statements they come from. Make sure your income statement, balance sheet, and cash flow data are current and clean.
- Benchmark against your industry. A strong debt-to-equity ratio in one sector may be a concern in another. Always compare within context.
The DuPont Model is one structured approach to multi-ratio analysis. It breaks down return on equity into three components: profit margin, asset turnover, and financial leverage. This gives a clearer picture of what is actually driving performance.
Financial Ratios and Business Planning
Financial ratios are not just for looking backward. They are essential tools for financial forecasting and planning.
When you understand your current ratio trends, you can plan working capital needs months in advance. When you track inventory turnover ratio, you can make smarter purchasing decisions. Additionally, when you monitor net profit margin alongside asset turnover, you can catch efficiency problems before they become crises.
Business leaders who use financial ratios regularly make faster, more confident decisions. They can spot a cash flow problem early, justify investment decisions with hard numbers, and present clear financial performance data to boards, investors, or lenders.
Common Mistakes in Ratio Analysis
Even experienced managers make these errors:
- Relying on one ratio. A strong gross profit margin does not mean a healthy business if leverage ratios are extreme.
- Ignoring non-financial context. A falling inventory turnover might reflect a deliberate strategy to hold safety stock, not poor sales.
- Using outdated data. Financial ratios need to be calculated from current accounting statements, not last year’s numbers.
- Skipping comparisons. A ratio only makes sense when benchmarked against something. Always compare.
- Confusing correlation with causation. A declining return on assets might have many causes. Ratios point you toward questions, not automatic answers.
Financial Ratios for Different Business Sizes
Small businesses use ratios differently than large corporations. A startup might focus heavily on burn rate and liquidity ratios to ensure survival. A growth-stage company might prioritize efficiency ratios to maximize return from limited resources.
For nonprofits, specific ratios like the fundraising efficiency ratio, program service ratio, and program ratio matter most. These measure how much of every donated dollar actually goes toward the mission versus administrative costs.
Publicly traded companies and large enterprises also need to focus on market value ratios, earnings per share, and return on equity to satisfy investors and analysts.
Regardless of size, the principles of ratio analysis remain the same. The goal is always clarity about financial health.
Frequently Asked Questions
What is the most important financial ratio?
There is no single most important ratio. It depends on your goals. If you are assessing short-term survival, the current ratio and quick ratio matter most. For profitability, focus on net profit margin and return on equity. For debt management, check the debt-to-equity ratio and coverage ratios.
How often should I review financial ratios?
Monthly reviews work well for most businesses. Quarterly analysis is a minimum. Annual review is not enough if you want to catch problems early and make timely adjustments.
What is a good current ratio?
A current ratio between 1.5 and 2.0 is generally considered healthy. Below 1.0 is risky. Above 3.0 might suggest assets are not being put to productive use.
Can financial ratios predict business failure?
Yes, to a degree. Research consistently shows that declining liquidity ratios, rising debt ratios, and falling profitability ratios together can signal financial distress well before a crisis becomes visible. Regular ratio analysis is one of the best early warning tools available.
What is the difference between liquidity ratios and solvency ratios?
Liquidity ratios focus on short-term obligations, usually within 12 months. Solvency ratios (a subset of leverage ratios) focus on long-term financial stability and the ability to meet all debts over time.
How do financial ratios relate to International Financial Reporting Standards?
Financial ratios are calculated from financial statements. If those statements are prepared under International Financial Reporting Standards, the underlying numbers may differ from those prepared under local accounting rules. Always confirm the accounting standards used before comparing ratios across companies in different countries.
What are efficiency (activity) ratios?
Efficiency (activity) ratios measure how well a company uses its resources to generate revenue. Key examples include the asset turnover ratio, inventory turnover ratio, and receivables turnover ratio.
Conclusion
Understanding financial ratios is one of the highest-leverage skills any business leader can develop. Whether you are reviewing a balance sheet for the first time or preparing for your next board meeting, ratios give you the clarity to make smarter, faster decisions.
If you want expert support turning your financial data into a strategy for growth, Oak Business Consultant offers specialized CFO services designed for businesses that are serious about performance. From ratio analysis and financial forecasting to full-scale financial statement analysis, our team is ready to help you build the financial intelligence your business needs. Reach out now for a free consultation.