SDG 14 Life Below Water, and the 2.8% of Ocean Actually Protected
SDG 14: Life Below Water, and Why Marine Protection Keeps Falling Short
Countries have pledged to protect 30% of the ocean by 2030. As of mid-2026, only 2.8% is actually, effectively protected. The rest of the pledged area exists mostly on paper.
SDG 14 asks the world to conserve and sustainably use the ocean. More than 3 billion people depend on it for food and income. Ten years in, protection is expanding slowly, fish stocks keep declining, and ocean research stays badly underfunded.
This guide covers what SDG 14 actually asks of the world. It shows where progress stands, target by target. It also ranks the countries protecting their waters best, and the ones falling furthest behind.
What is SDG 14
SDG 14 calls for conserving and sustainably using the oceans, seas, and marine resources. That is the UN’s own wording. It is the fourteenth of 17 Sustainable Development Goals.
All 193 UN member states adopted it in 2015, as part of the 2030 Agenda. The goal covers pollution, acidification, overfishing, marine protection, and ocean science together. A country can pledge huge marine protected areas and still barely enforce them. It can sign every ocean treaty and still overfish its own waters. SDG 14 tracks pledges against real outcomes on purpose.
The official targets and indicators behind SDG 14
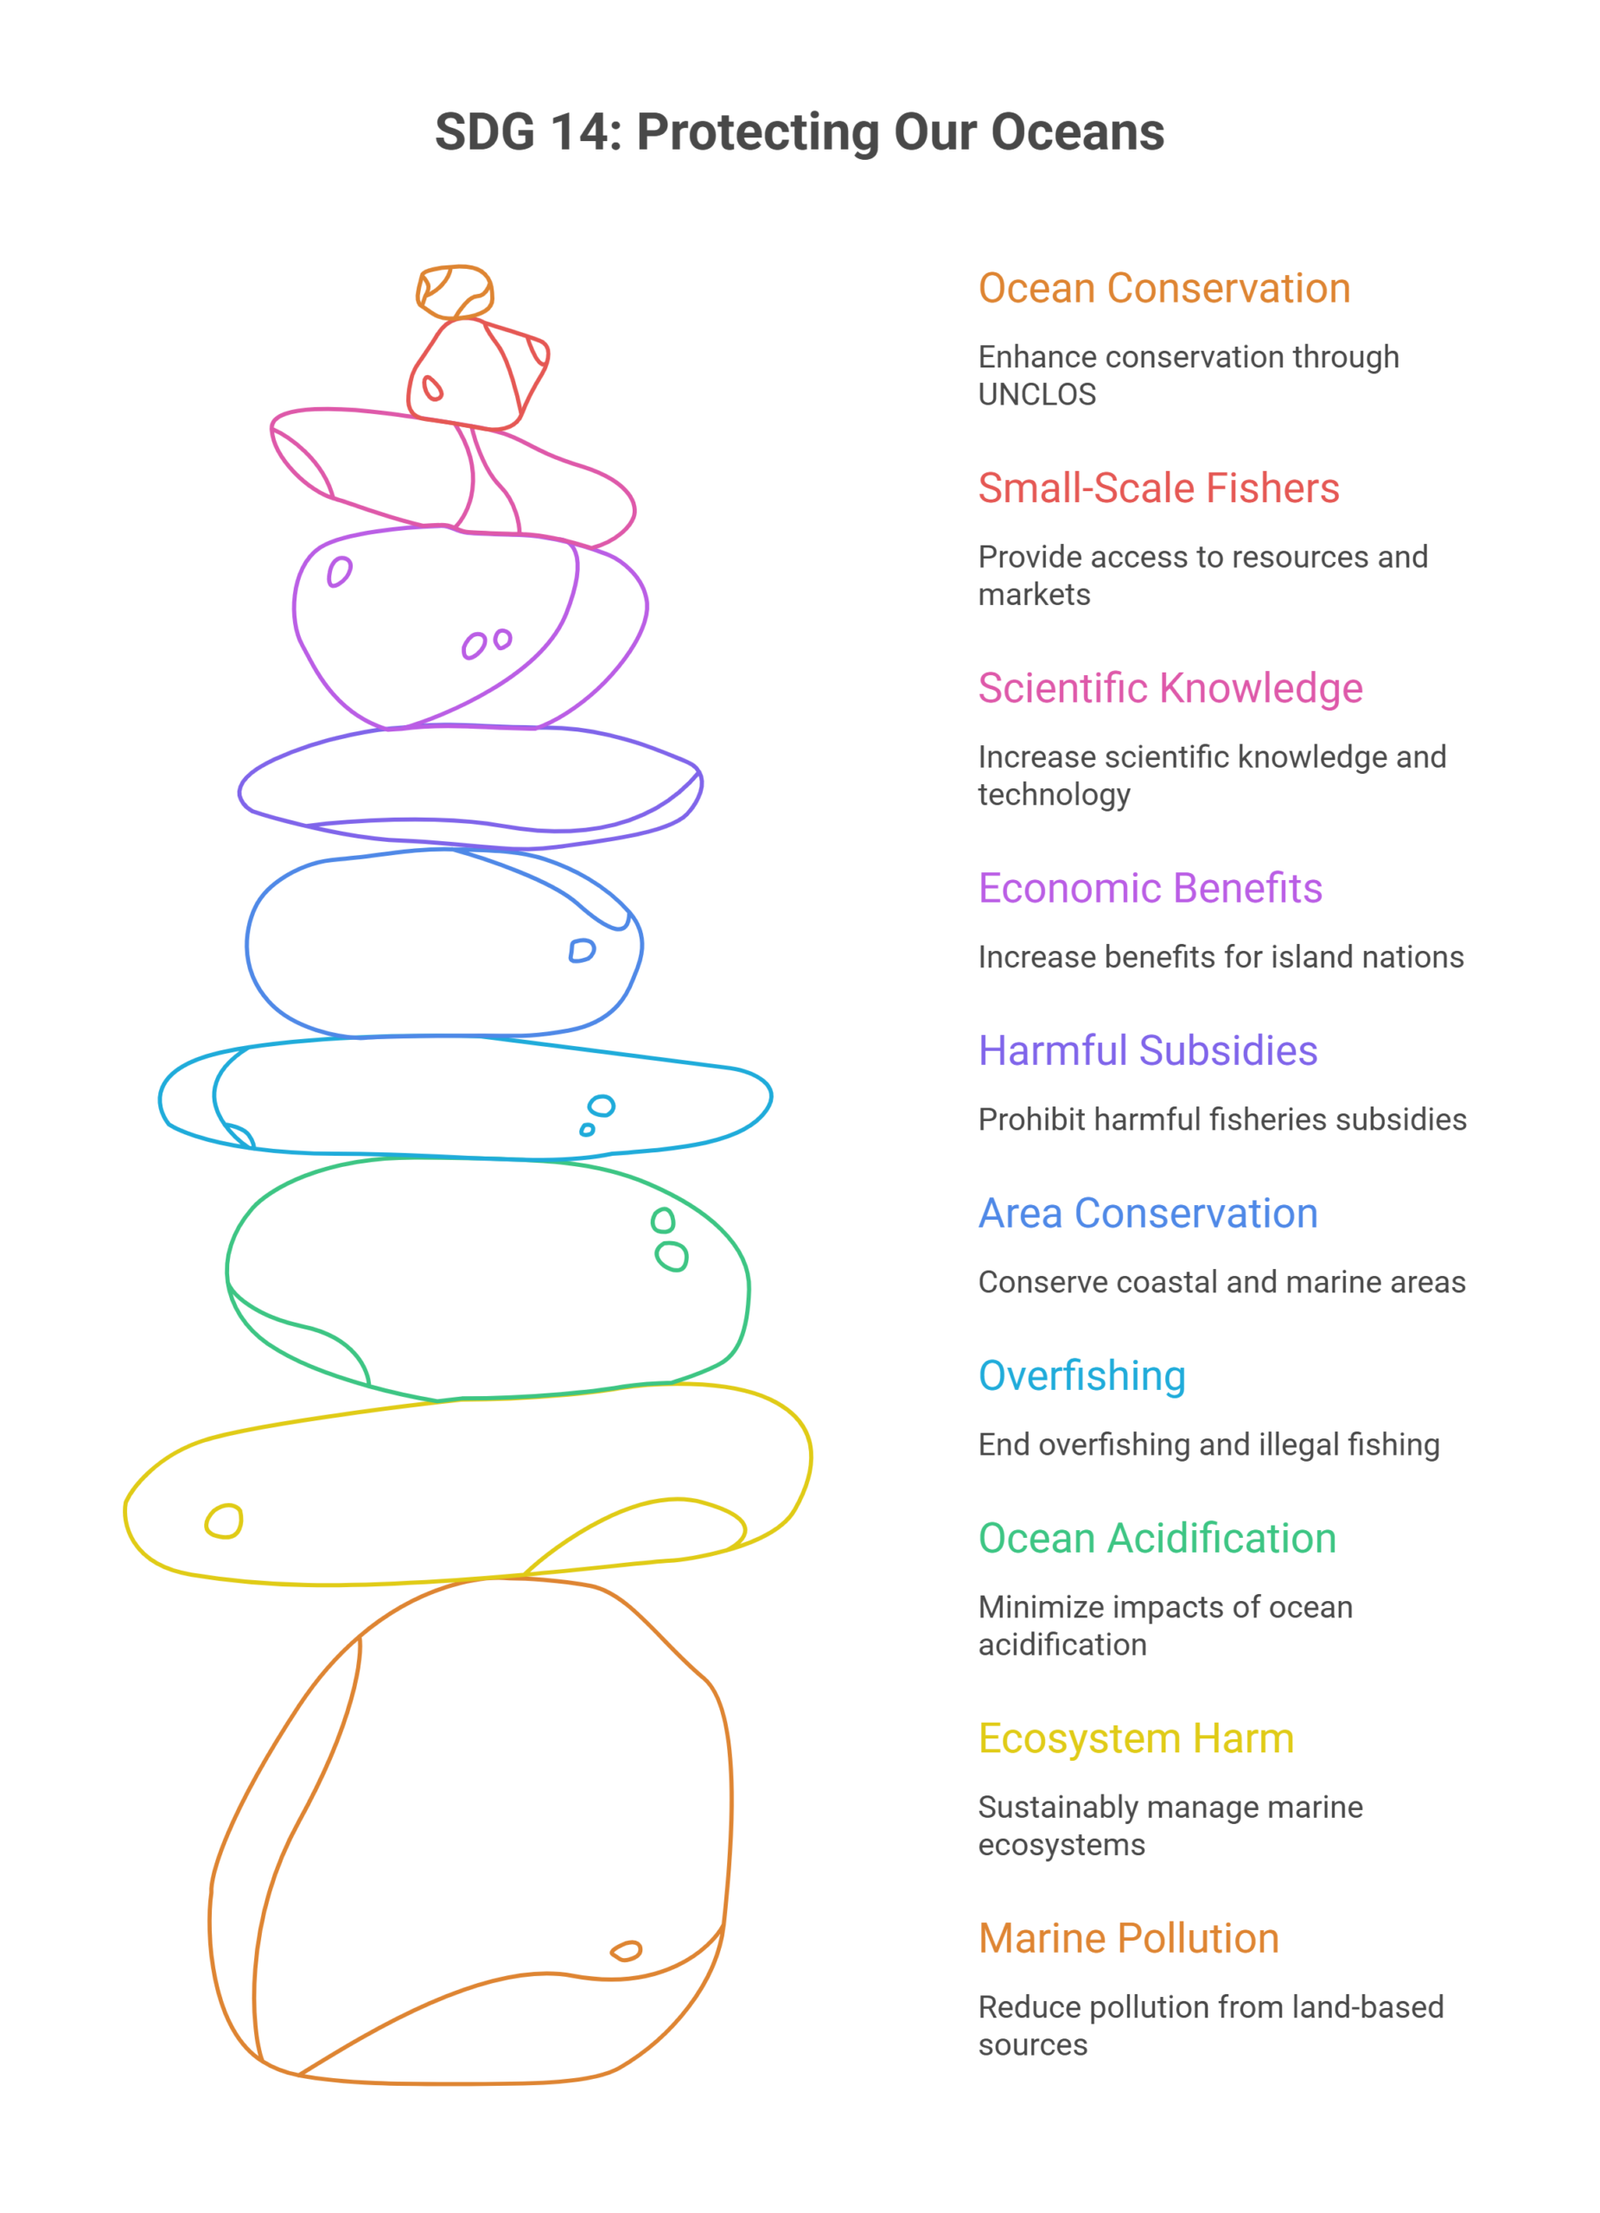
SDG 14 breaks down into 10 targets, tracked through 10 indicators, according to the UN’s SDG 14 page.
Target 14.1: By 2025, prevent and significantly reduce marine pollution of all kinds, especially from land-based sources. Tracked through coastal eutrophication and plastic debris density.
Target 14.2: By 2020, sustainably manage and protect marine and coastal ecosystems to avoid significant harm. Tracked through the number of countries using ecosystem-based marine management.
Target 14.3: Minimize and address the impacts of ocean acidification through stronger scientific cooperation. Tracked through average marine acidity at representative sampling stations.
Target 14.4: By 2020, end overfishing and illegal, unreported, and unregulated fishing, restoring stocks to sustainable levels. Tracked through the share of fish stocks within biologically sustainable levels.
Target 14.5: By 2020, conserve at least 10% of coastal and marine areas, based on the best science available. Tracked through the coverage of protected areas relative to marine areas.
Target 14.6: By 2020, prohibit harmful fisheries subsidies that fuel overcapacity and overfishing. Tracked through countries’ implementation of instruments combating illegal, unreported, and unregulated fishing.
Target 14.7: By 2030, increase the economic benefits island and least developed nations get from marine resources. Tracked through sustainable fisheries as a share of GDP.
Target 14.a: Increase scientific knowledge, research capacity, and marine technology transfer, especially for developing nations. Tracked through the share of national research budgets spent on marine technology.
Target 14.b: Provide small-scale artisanal fishers access to marine resources and markets. Tracked through legal and policy frameworks protecting small-scale fisheries.
Target 14.c: Enhance ocean conservation through the United Nations Convention on the Law of the Sea. Tracked through countries implementing that legal framework and related instruments.
Where global progress actually stands
The picture comes from the UN’s 2026 SDG 14 progress update, part of the annual Sustainable Development Goals Report. The ocean’s largest legal milestone in years arrived in January 2026. The BBNJ Agreement entered into force that month. It created a real legal framework to protect biodiversity across two-thirds of the ocean beyond any single country’s jurisdiction.
Ocean acidification keeps worsening as CO2 emissions keep rising. Monitoring has expanded fast, though, from 178 stations in 2021 to 906 by 2026. That growth in monitoring capacity has not slowed the underlying acidification trend.
Overfishing remains widespread. The latest assessed data, from 2021, show 35.5% of fish stocks at biologically unsustainable levels. A modest 2% decline has been recorded over six years, and the trend appears to be stabilizing rather than reversing.
Marine spatial planning is spreading. In 2024, 126 countries and territories had marine spatial planning efforts underway, up 20% from 2023. Only 45 of them had formally approved plans in place. Fisheries subsidies enforcement improved too. As of January 2025, 78 parties had joined the Agreement on Port State Measures against illegal fishing. They represent 65% of the world’s coastal states. The global average implementation score reached 4 out of 5, up from 3 out of 5 in 2018.
Small-scale fisheries protections slipped slightly. The global score for legal frameworks protecting small-scale fishers fell from 5 in 2022 to 4 in 2024. That is based on reports from 112 countries. The longer trend since 2018 still points upward.
The economics tell a mixed story. Sustainable fisheries fell to just 0.081% of global GDP in 2023, the third straight year of decline. Fisheries and aquaculture value added still grew, reaching $175 billion the same year. Marine research funding remains the clearest underinvestment. Median national research budgets allocated to marine technology stayed under 1% between 2013 and 2024. The ocean economy, by contrast, generates 3% to 4% of the world’s gross value added.
Marine protection itself is the starkest gap. Only 2.8% of the ocean is effectively protected, according to a 2026 assessment reported by Earth.org. That is far short of the 30% global target for 2030.
The table below summarizes where the core SDG 14 indicators stood in the latest reporting.
| Indicator | Latest figure |
| BBNJ high-seas biodiversity treaty | Entered into force January 2026 |
| Ocean acidification monitoring stations | 906 (2026), up from 178 in 2021 |
| Fish stocks at unsustainable levels | 35.5% (2021 data, latest available) |
| Countries in marine spatial planning | 126 (2024), up 20% from 2023 |
| Coastal states in Port State Measures Agreement | 78 parties, 65% of coastal states (Jan 2025) |
| Sustainable fisheries share of global GDP | 0.081% (2023), a third straight annual decline |
| Fisheries and aquaculture value added | $175 billion (2023) |
| National research budgets spent on marine tech | Under 1% (2013 to 2024 average) |
| Ocean’s share of global gross value added | 3% to 4% |
| Ocean effectively protected | 2.8% (2026), against a 30% target for 2030 |
Source: UN Department of Economic and Social Affairs, SDG 14 progress data, and Earth.org’s 2026 marine protection assessment.
Countries ranked by SDG 14 performance
Ranking countries on pledged protected area alone hides half the story. Many countries declare huge marine parks that allow fishing, drilling, or shipping to continue inside them. The list below weighs both dimensions together: protection quality first, fisheries governance second. It runs from the strongest performer down to the weakest.
Palau leads this list outright, combining broad coverage with real, enforced protection. Belgium and Norway lead on governance and ocean science rather than territory size. The UK and France lead on scale, largely through remote overseas territories. The UAE shows a sharp split between pledged protection and real fish stock health. Pacific island states carry the heaviest economic dependence on healthy oceans, with the least capacity to protect them. China anchors the bottom, ranked the world’s riskiest country for illegal fishing for three straight assessment cycles.
| Rank | Country | Protection or governance signal | Standing |
| 1 | Palau | 99% of its waters designated as marine protected, 78% effectively enforced | Best combined performer: broad coverage paired with genuine, enforced protection |
| 2 | United Kingdom | 68% of waters designated as protected, largely through overseas territories | Ranked first globally for blue technology and marine research investment |
| 3 | Belgium | Among the lowest-risk countries on the IUU Fishing Risk Index | Strong fisheries governance, despite a small coastal footprint |
| 4 | Norway | Leads the international High Level Panel for a Sustainable Ocean Economy | Heavy investment in ocean science, monitoring, and blue economy research |
| 5 | France | One of the largest marine protected area networks by total size | Scale driven mostly by remote Pacific and Indian Ocean territories |
| 6 | United States | Large marine protected area network by size, but modest by coverage share | Substantial pledged protection, uneven on enforcement and effective coverage |
| 7 | United Arab Emirates | Once ranked first in the world for marine protected area coverage | Strong pledged protection undercut by severe overfishing, now improving fast |
| 8 | Pacific small island developing states | Fisheries historically near 1.5% of GDP, among the highest shares worldwide | High economic dependence on the ocean, paired with the least enforcement capacity |
| 9 | China | Ranked the world’s riskiest country on the IUU Fishing Risk Index | Weakest fisheries governance on this list, though showing recent improvement |
Palau
Palau has designated 99% of its national waters as protected, and roughly 78% of that area is genuinely, effectively enforced. That combination makes it the world’s strongest performer on marine protection, according to a 2026 marine conservation assessment.
Palau’s National Marine Sanctuary bans commercial fishing across 80% of its exclusive economic zone. The remaining waters are reserved for small-scale, local fishing. The country has also set a further 2030 target. It aims to protect 30% of its marine area, on top of what it already enforces.
Belgium and Norway

Norway and Belgium show that governance and research spending matter as much as territory size. Belgium consistently ranks among the world’s lowest-risk countries on theIUU Fishing Risk Index, despite having a small coastline.
Norway leads the international High Level Panel for a Sustainable Ocean Economy. This is a coalition of world leaders working on ocean governance. It is also one of the largest contributors to the UN Decade of Ocean Science. It funds marine monitoring and research programs across Africa and the Bay of Bengal.
United Kingdom and France
The UK and France both lead on scale, but through very different routes. The UK has designated 68% of its waters as protected, though only about 39% is effectively enforced. Roughly 90% of that protection sits in overseas territories, not domestic waters, according to the same 2026 assessment.
The UK also ranks first globally on blue technology investment, per MIT Technology Review Insights’ Blue Technology Barometer. France’s marine protected area network is one of the largest in the world by total size. Huge exclusive economic zones around territories like French Polynesia and New Caledonia drive that scale.
United States
The US holds one of the largest marine protected area networks in the world by total size. It ranks among the top five globally. Coverage as a share of national waters remains far more modest than leaders like Palau or the UK, though.
Much of the US network sits in remote Pacific territories rather than densely used domestic waters. That pattern is shared with several other large economies on this list. Pledged protection and effective, enforced protection remain two different numbers here.
United Arab Emirates
The UAE shows a genuine paradox: strong marine protection commitments paired with a real fisheries crisis. It ranked first in the world for marine protected area coverage in 2018. The country has 16 designated marine protected areas covering over 15% of its territory.
That protection has not stopped overfishing. As much as 80% of UAE fish stocks have been overexploited or depleted. Key species like hamour and kanaad have been fished at up to five times sustainable levels. The country now imports 70% of the seafood it eats. There are real signs of a turnaround, though. Abu Dhabi’s Sustainable Fishing Index jumped from just 8% in 2018 to a full 100% by the end of 2025. That is one of the sharpest fisheries recoveries tracked anywhere.
Pacific small island developing states
Few places depend on the ocean as directly as Pacific island nations. Sustainable marine fisheries have historically contributed close to 1.5% of GDP across these states. That is among the highest shares recorded anywhere, according to earlier UN SDG 14 reporting.
That dependence cuts both ways. These states also have some of the least capacity to monitor and patrol their vast exclusive economic zones. Distant-water fishing fleets from wealthier nations often operate in these waters, adding real pressure that local governments struggle to police.
China
China has ranked as the world’s riskiest country on the IUU Fishing Risk Index. That has held true in every edition since the index launched in 2019. Its distant-water fishing fleet, the largest in the world, is central to that ranking.
There are real signs of change. China joined the Agreement on Port State Measures against illegal fishing in April 2025. That is a step toward the international fisheries framework other major economies already follow. Its overall IUU score has also improved slightly across recent assessment cycles. It still remains the highest, or worst, score in the world.
What organizations and institutions are doing
Several UN bodies and agencies track and coordinate progress on SDG 14, alongside national governments.
UN Department of Economic and Social Affairs: DESA compiles the annual SDG progress report. It tracks all 10 indicators across pollution, fisheries, and marine protection.
Food and Agriculture Organization: The FAO produces the State of World Fisheries and Aquaculture report. It is the main source behind Target 14.4’s fish stock data.
Intergovernmental Oceanographic Commission: The IOC coordinates the UN Decade of Ocean Science. That effort is the global framework behind most marine research funding tracked under Target 14.a.
High Level Panel for a Sustainable Ocean Economy: This coalition of world leaders is chaired by Norway. It works to align ocean protection with sustainable economic use across member countries.
How businesses can contribute to SDG 14
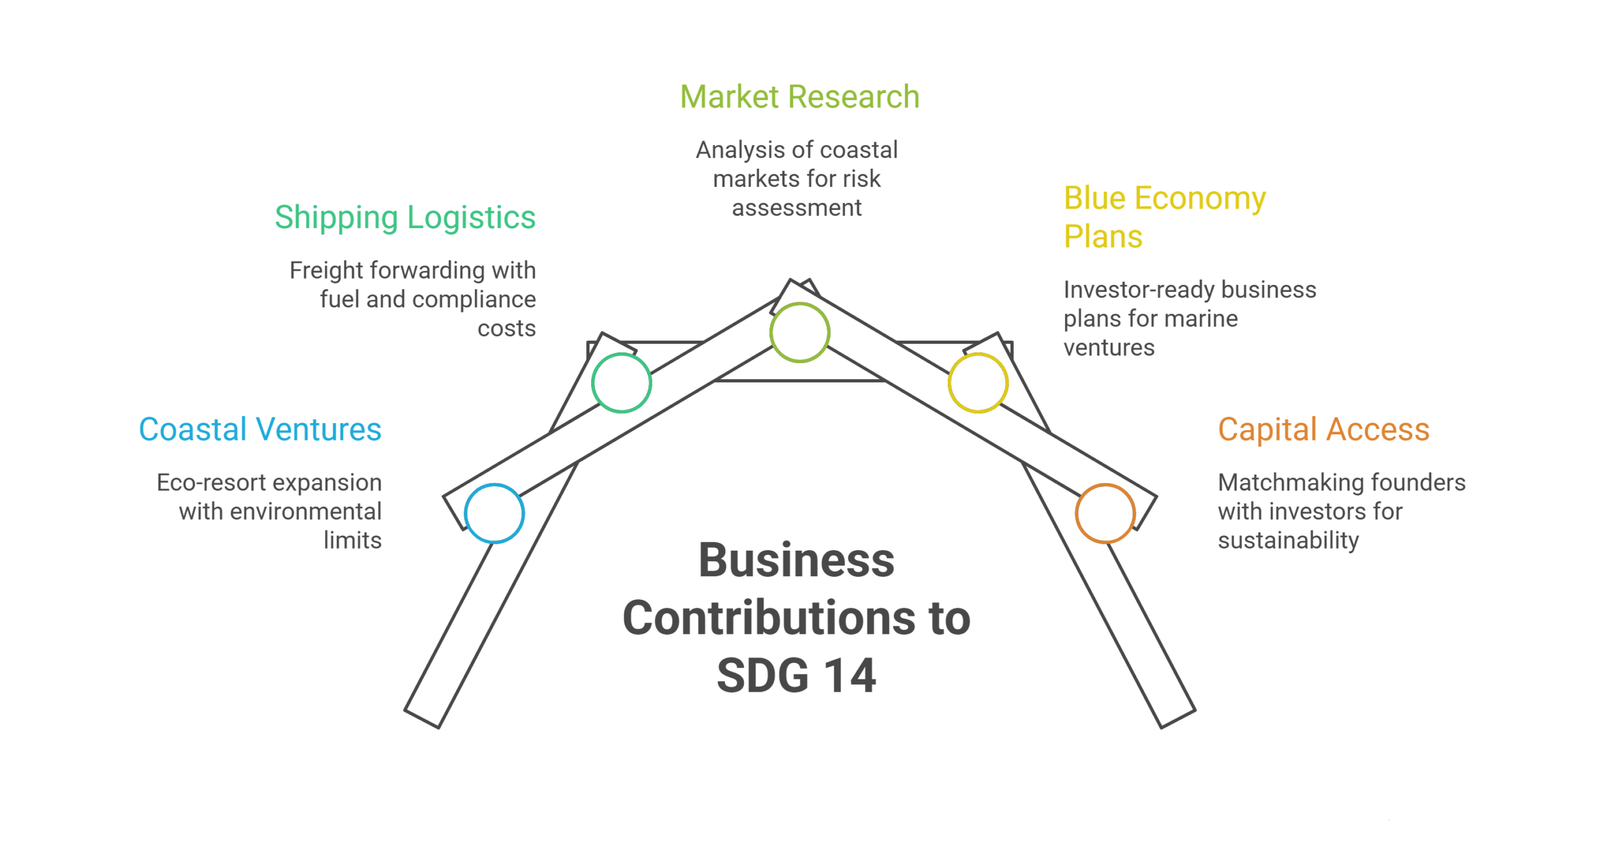
The same approach applies here as with any SDG a company has no formal mandate on. Start with where operations touch the coast, the fisheries, or the ocean supply chain. Then look outward from there.
Model coastal and marine ventures with real environmental limits built in. Target 14.7 is about sustainable economic benefit, not extraction at any cost. Oak’s work modeling an eco-resort expansion across three island properties shows what that balance looks like in practice.
Treat shipping and maritime logistics as an SDG 14 touchpoint. A freight forwarding business plan accounts for fuel, routing, and compliance costs upfront. That kind of planning avoids the corner-cutting that fuels marine pollution.
Research coastal markets before committing capital. Palau’s enforcement and China’s fleet risk both show that ocean-facing markets vary enormously in governance quality. Market research services can size that risk before capital moves, not after.
Put a real business plan behind blue economy ventures. An investor-ready business plan is what turns an aquaculture, tourism, or marine science concept into something lenders can actually evaluate.
Treat access to capital as part of the sustainability picture. Coastal and small island businesses often struggle to reach investors at all. Matchmaking founders with the right investors turns that search into a structured process, not a guessing game.
Frequently Asked Questions
How many SDG 14 targets and indicators are there?
Ten targets, tracked through 10 indicators. Seven targets are numbered outcome targets. Three cover research, small-scale fisheries, and international law.
Is the world on track to meet SDG 14 by 2030?
No. Marine protection sits at 2.8% effective coverage against a 30% target, and overfishing remains widespread despite modest recent gains.
Which countries are performing best on SDG 14?
Palau combines the broadest coverage with the strongest enforcement. The UK and France lead on scale, and Belgium and Norway lead on governance and research.
Which country is performing worst on SDG 14?
China has ranked as the riskiest country on the IUU Fishing Risk Index in every edition since 2019. It has shown recent signs of improvement.
What actually changed for the ocean in 2026?
The BBNJ Agreement entered into force in January 2026. It is the first binding legal framework protecting biodiversity across the two-thirds of the ocean beyond national borders.
Why do so few countries meet the 30% marine protection target?
Many countries declare large protected areas that still allow fishing or drilling inside them. Declared protection and effectively enforced protection are very different numbers.
Can a business without an ocean mandate still contribute to SDG 14?
Yes. The clearest levers are modeling ventures within real environmental limits and researching markets honestly. Treating maritime logistics as a real compliance issue helps too.
Conclusion
The number worth sitting with is not the 30% marine protection target countries have pledged. That headline sounds close to done. The real number is 2.8%, the share of the ocean that is actually, effectively protected today.
Palau shows what enforced protection looks like at national scale. Norway and Belgium show that governance and research spending matter as much as territory size. China shows that even the world’s largest fishing fleet can start shifting toward international rules, slowly, once real pressure builds.
None of that gets solved by declarations alone. It gets solved by ventures and governments that plan for real environmental limits from the start.
Building the financial case for a coastal, tourism, or blue economy venture? Oak’s financial modeling and market research services can help. Oak builds the numbers behind the ocean economy.