SDG 11: Sustainable Communities and 1.13 Billion People Living in Slums
A decade in, cities are growing faster than they can cope
More than half the world now lives in cities. That share could reach 70% by 2050.
In 2026, 1.13 billion people live in slums or informal settlements. That number keeps rising, even as the share of urban residents in slums slowly falls.
Public transport access improved. Open public space did not. It actually shrank between 2020 and 2025.
Cities are also expanding faster than their populations. That reverses a 20-year trend of slower, denser growth.
This guide covers what SDG 11 actually asks of the world. It shows where 2026 progress stands, country by country. It also covers what businesses can do about it.
What is SDG 11
SDG 11 aims to “make cities and human settlements inclusive, safe, resilient and sustainable.” It is the eleventh of 17 Sustainable Development Goals.
All 193 UN member states adopted it in 2015, as part of the 2030 Agenda.
The goal has ten targets. Seven are outcome targets. Three cover heritage, disaster resilience, and finance for the poorest countries.
It spans housing, transport, urban planning, heritage, disaster risk, waste, air quality, and public space. Progress on one front rarely fixes another.
A city can build a metro line and still lack open parks. It can cut disaster deaths and still lose more homes to floods. SDG 11 tracks each piece on its own.
The official targets and indicators behind SDG 11
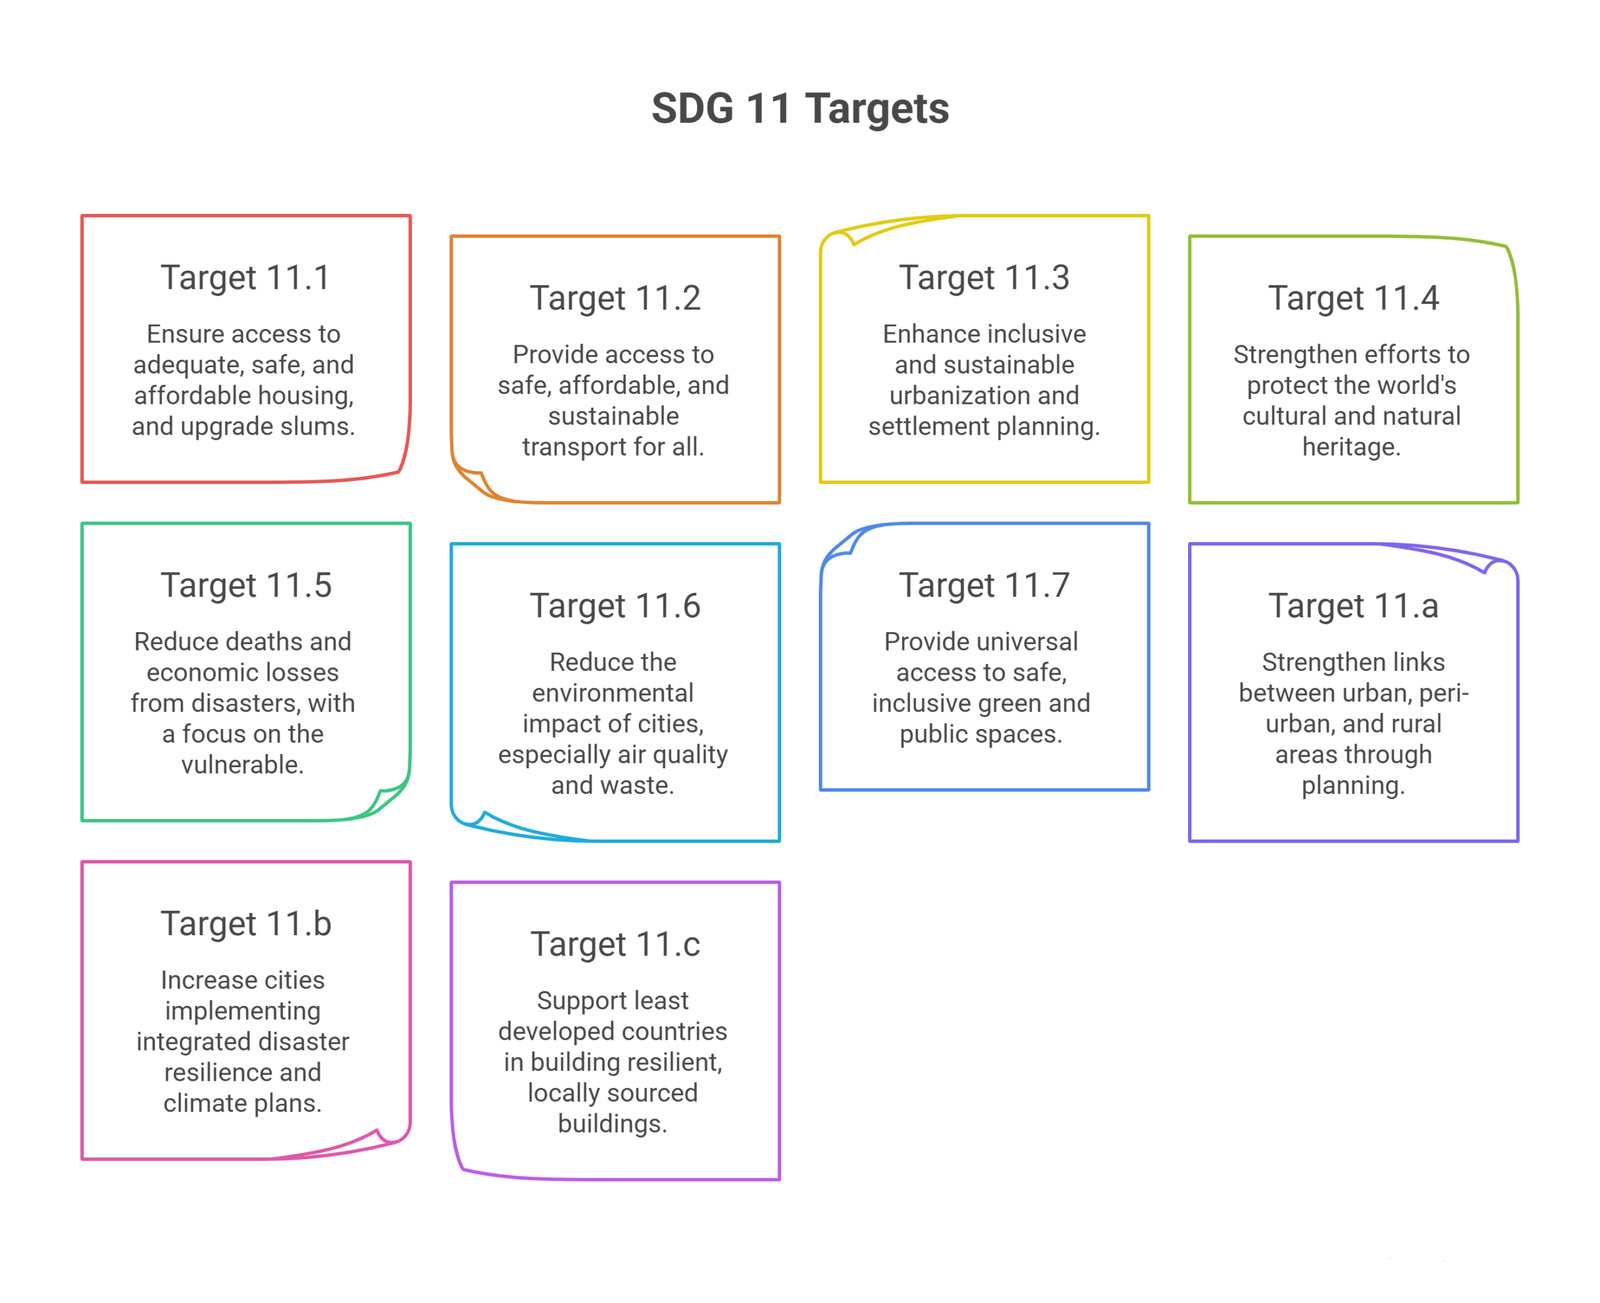
SDG 11 breaks down into ten targets, tracked through 15 indicators, according to the UN’s SDG 11 page.
Target 11.1: Ensure access to adequate, safe, and affordable housing, and upgrade slums. Tracked through the share of the urban population in slums or inadequate housing.
Target 11.2: Provide access to safe, affordable, and sustainable transport for all. Tracked through convenient public transport access, especially for vulnerable groups.
Target 11.3: Enhance inclusive and sustainable urbanization and settlement planning. Tracked through land consumption relative to population growth, and civil participation in planning.
Target 11.4: Strengthen efforts to protect the world’s cultural and natural heritage. Tracked through per capita spending on heritage preservation.
Target 11.5: Reduce deaths and economic losses from disasters, with a focus on the vulnerable. Tracked through disaster mortality, economic loss, and infrastructure damage.
Target 11.6: Reduce the environmental impact of cities, especially air quality and waste. Tracked through waste management coverage and fine particulate matter levels.
Target 11.7: Provide universal access to safe, inclusive green and public spaces. Tracked through open public space as a share of city land, and harassment rates.
Target 11.a: Strengthen links between urban, peri-urban, and rural areas through planning. Tracked through countries with supportive national urban policies.
Target 11.b: Increase cities implementing integrated disaster resilience and climate plans. Tracked through national and local disaster risk reduction strategies.
Target 11.c: Support least developed countries in building resilient, locally sourced buildings. Tracked through official development assistance for urban infrastructure.
Where global progress actually stands
The data comes from the 2026 Extended Report on SDG 11, compiled by UN-Habitat and partner agencies.
Slum populations keep growing. An estimated 1.13 billion people live in slums today. Left unchecked, that figure could reach 1.2 billion by 2030.
Public transport access improved, but from a low base. Convenient access rose from 51.5% to 60.4% between 2020 and 2025. Most of that access still runs on low-capacity buses, not rail.
Cities are sprawling faster than they are growing. Land consumption jumped to 2.3% a year between 2020 and 2025. Population growth, by contrast, slowed to 0.9% a year.
Open public space is shrinking in relative terms. Only 17.0% of urban land is open space, still short of the 30-45% UN-Habitat target. Convenient access to that space fell from 48.9% to 45.6% of city dwellers.
Air quality has stalled. Fine particulate matter held at 26 micrograms per cubic metre in 2023. That is roughly five times the WHO guideline.
Disaster resilience is a rare bright spot. Global disaster mortality fell 65% between 2005 and 2024. The number of people affected by disasters more than doubled over the same period.
Urban infrastructure financing for the poorest countries stayed thin. Housing received about $111 million in 2024. Water and sanitation received roughly $10 million, a fraction of what cities need.
The table below summarizes where the core SDG 11 indicators stood in the latest reporting.
| Indicator | Latest figure |
| People living in slums or informal settlements | 1.13 billion (2026) |
| Convenient access to public transport | 60.4% of the urban population (2025) |
| Annual urban land consumption rate | 2.3% (2020–2025), up from 1.4% |
| Urban land allocated to open public space | 17.0% (2025), against a 30–45% target |
| Fine particulate matter in cities | 26 µg/m3 (2023), roughly 5x WHO guidance |
| Average annual disaster mortality rate | 0.75 per 100,000 (2015–2024), down 65% |
| Countries with national disaster risk strategies | 141 of 196 countries (2025) |
| ODA for urban housing infrastructure | $111 million (2024) |
Source: UN-Habitat, UNDRR, WHO, and UNESCO-UIS, 2026 Extended Report on SDG 11.
Countries ranked: from best performing to struggling
Slum prevalence varies more sharply than almost any other SDG 11 indicator. A handful of countries have eliminated it entirely. Others still count more than nine in ten city dwellers as slum residents.
At the top, Singapore reports a 0% slum population, according to its own national statistics office. At the bottom, South Sudan reports 94.2%.
Population size shifts the picture too. Nigeria’s largest cities house tens of millions of slum residents. That is true even though its national rate sits below South Sudan’s or Mali’s.
| Country | Slum population share | Standing |
| Singapore | 0% | No slum population, per national statistics |
| India | 41.5% | Down from 55% in 2002, but still large in absolute numbers |
| Afghanistan | 71.6% | One of the highest national rates worldwide |
| Nigeria (Lagos) | 79% | Among the largest absolute slum populations in the world |
| Mali | 92.5% | Second-highest national rate worldwide |
| South Sudan | 94.2% | Highest national rate worldwide |
Singapore

Singapore shows what sustained public investment in housing can do.
In 1959, only 9% of Singaporeans lived in government-built housing. Most lived in squatter settlements or slums.
The government created the Housing and Development Board in 1960. It planned entire towns, not just apartment blocks.
Each town paired housing with schools, clinics, transport, and markets. That integration became central to the model’s success.
Today, 82% of Singaporeans live in HDB flats. About 90% of them own their homes.
Singapore’s case backs a clear point. A single, well-funded agency with a long planning horizon can end slum housing within a generation.
UAE

The UAE does not appear in the ranking table above. UN-Habitat’s slum indicator is built for cities with large informal housing sectors. The UAE does not report a comparable national figure.
Its own data still tells a clear story. Under 10,000 people lived in slum conditions in 2022, according to national statistics. That is against a total population of over 10 million.
Rapid, planned urban development across Dubai and Abu Dhabi has left little room for informal settlements to take hold. Strict land-use control and heavy state investment in housing infrastructure explain most of that gap.
United States

The United States is not tracked under UN-Habitat’s slum indicator either. Its housing challenges show up in a different measure instead.
HUD’s point-in-time count found 745,652 people experiencing homelessness on a single night in January 2025. That figure fell 3.4% from 2024, the first year-on-year decline in nearly a decade.
That count measures homelessness, not slum housing. The two problems are related, but they are not the same indicator, and comparing them directly would be misleading.
South Sudan and Mali

South Sudan and Mali sit at the opposite end of the table.
Sudan’s urban population is 94.2% slum residents, the highest rate in the world. Conflict, displacement, and weak infrastructure investment all compound the problem.
Mali follows closely at 92.5%. Rapid, unplanned urban migration has outpaced any formal housing supply.
Both countries also rank among the weakest performers on disaster risk reduction. Neither has the fiscal space to fund large-scale housing programs alone.
Their experience shows what happens when urbanization outruns governance capacity. Housing deficits compound with every year of delay.
The sprawl paradox: cities are growing faster than their people
Urban land consumption reversed course after 2020. That is the least discussed shift in SDG 11 data.
Between 2015 and 2020, land consumption grew just 1.4% a year. Between 2020 and 2025, it jumped to 2.3%.
Population growth moved the opposite way. It slowed from 1.2% to 0.9% a year over the same window.
Cities, in other words, are spreading out even as growth slows. Analysts link part of this to shifting housing preferences after the pandemic.
The result is higher infrastructure costs per resident. It also means less efficient land use, and more pressure on farmland and natural habitats.
This paradox matters for anyone financing urban development. A city planned for density needs very different infrastructure than one planned for sprawl.
What organizations and institutions are doing
Several UN agencies coordinate SDG 11 monitoring and support. There is no single global fund.
UN-Habitat
UN-Habitat is the lead custodian agency for SDG 11. It publishes the SDG 11 Global Report and coordinates most urban indicator tracking.
UN Office for Disaster Risk Reduction
UNDRR tracks disaster mortality, economic loss, and resilience planning. It runs the Making Cities Resilient 2030 initiative, joined by over 1,780 local governments.
World Health Organization
WHO tracks urban air quality against its global guideline. It also documents the health impacts of prolonged exposure to fine particulate matter.
UNESCO Institute for Statistics
UNESCO-UIS tracks public spending on cultural and natural heritage preservation. Its data shows wide, uneven gaps in funding across regions.
How businesses can contribute to SDG 11
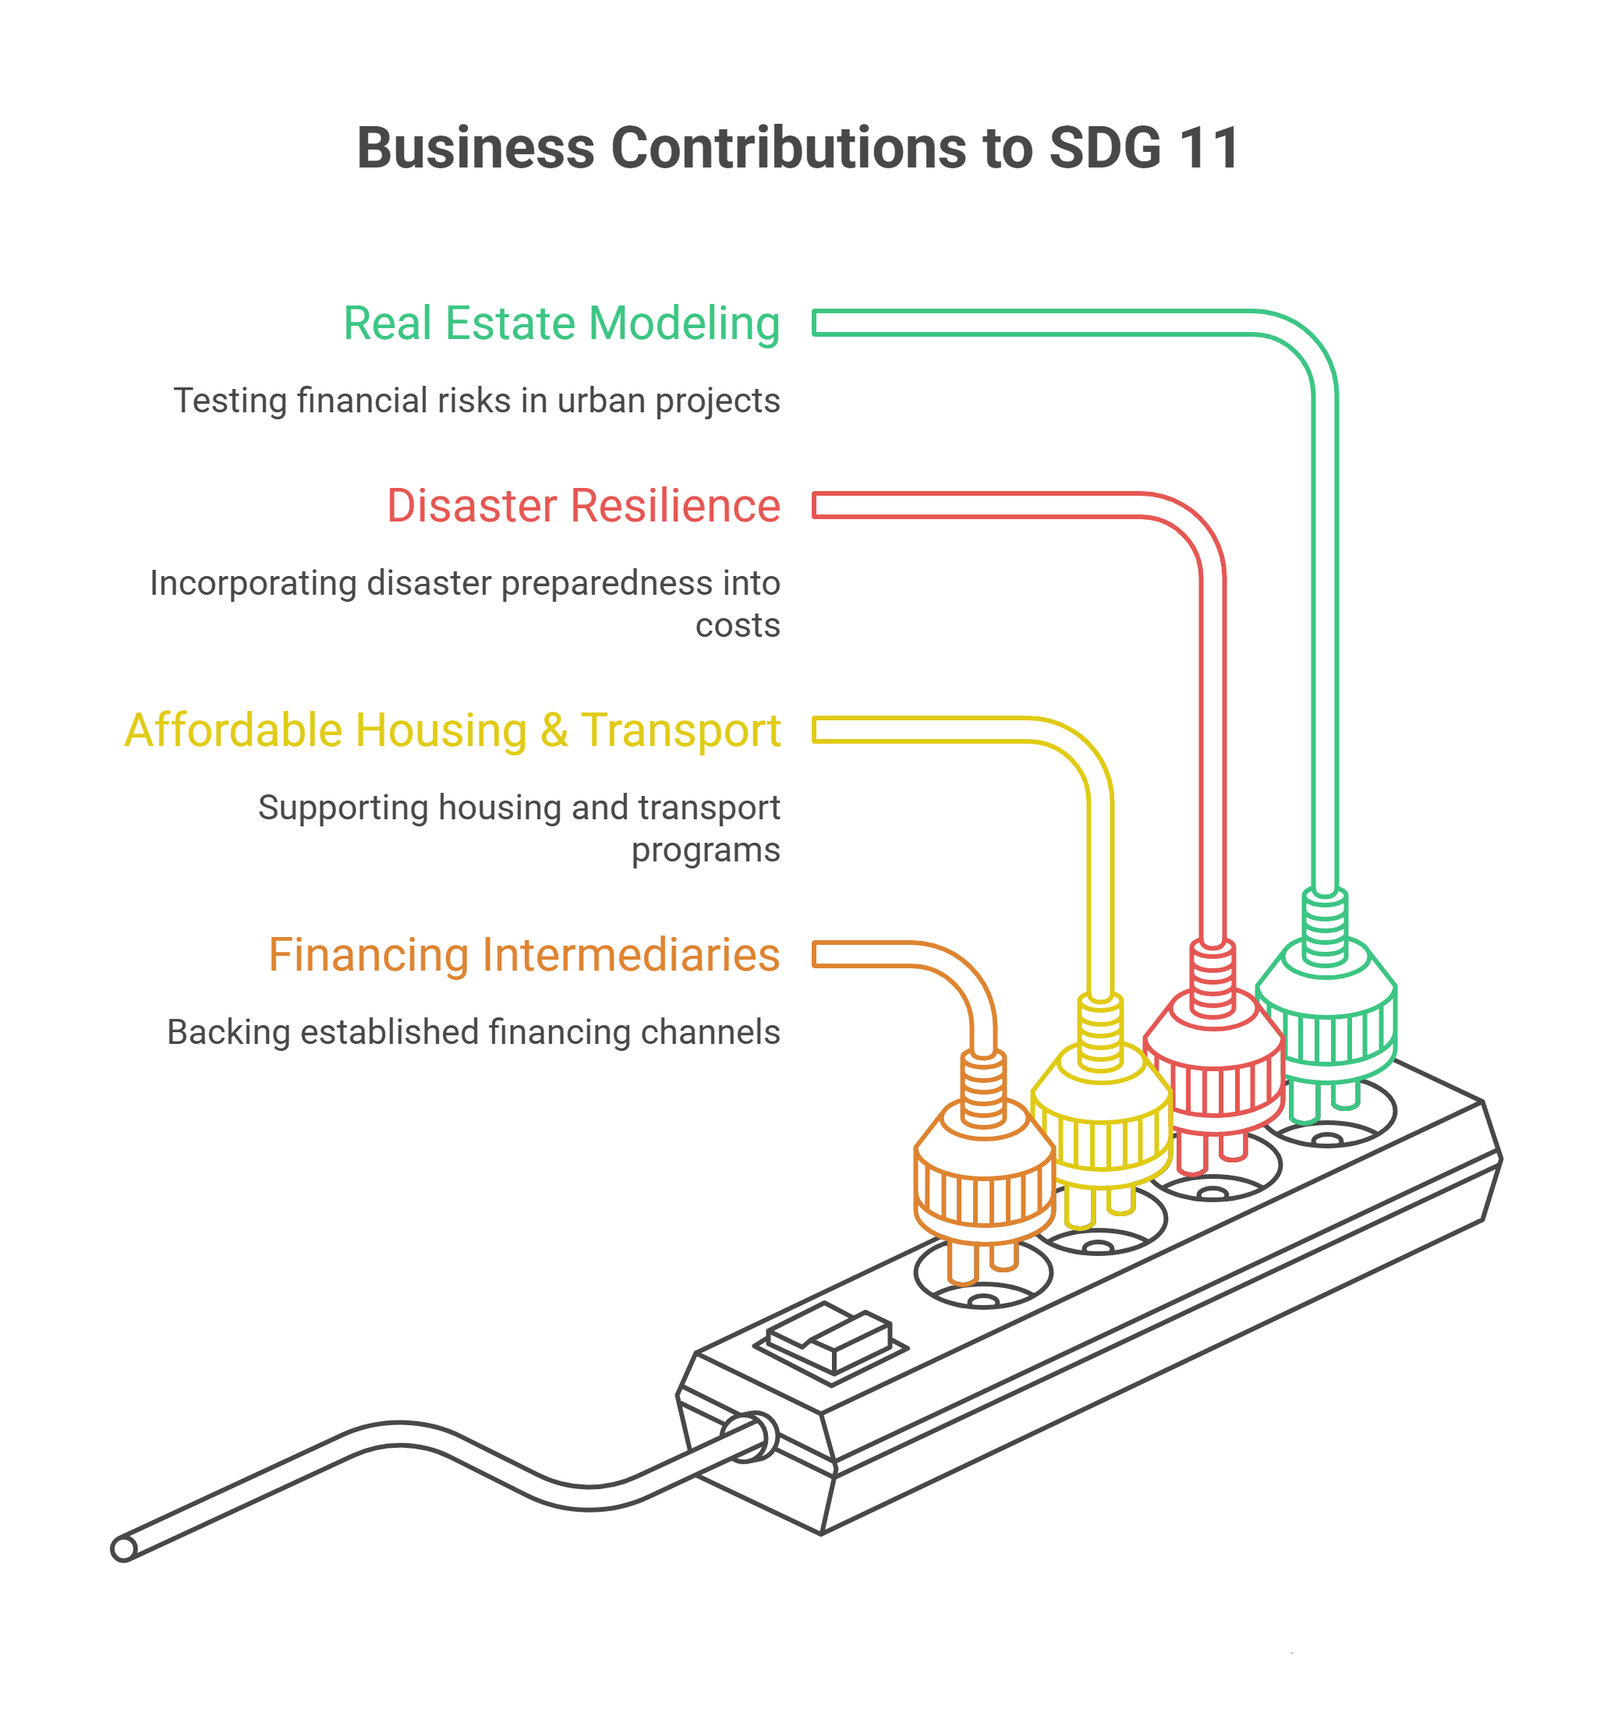
The same approach applies here as with any SDG a company has no formal mandate on. Start with where operations touch cities. Then look outward from there.
Model urban projects with real construction and land costs
Real estate and infrastructure projects carry real financial risk. A real estate financial model helps test land use, construction costs, and financing before capital moves. That discipline also applies to firms managing standing property portfolios. A documented real estate financial model case study shows how stress-testing debt and lease terms protects returns.
Treat disaster resilience as a real cost, not an afterthought
Direct disaster losses average $110 billion a year worldwide. Any business with physical assets in high-risk cities carries that exposure, whether it plans for it or not.
Support affordable housing and transport where you operate
Companies with large urban workforces can back employee housing or transport programs. That is a direct, measurable way to support Target 11.1 and 11.2 locally.
Back financing intermediaries instead of building parallel infrastructure
UN-Habitat and UNDRR already run coordinated financing and resilience channels. Adding capital to an established program usually reaches people faster. A standalone initiative rarely does.
Frequently Asked Questions
How many SDG 11 targets and indicators are there?
Ten targets, tracked through 15 indicators. Seven targets are outcome-focused. Three cover heritage, disaster resilience, and finance.
Is the world on track to meet SDG 11 by 2030?
No. The 2026 UN-Habitat report states plainly that SDG 11 remains off track overall, despite gains in specific areas.
Which countries have eliminated slum housing?
Singapore reports a 0% slum population. It reached that mark through decades of sustained public housing investment.
Which countries have the highest slum populations?
South Sudan and Mali report the highest national rates, at 94.2% and 92.5%. Nigeria has the largest absolute slum population.
Why is urban land consumption rising even as population growth slows?
Shifting housing preferences after the pandemic pushed more development toward suburbs and smaller towns. That reversed a 20-year trend toward denser cities.
Can a business without an urban mandate still contribute to SDG 11?
Yes. The clearest levers are modeling construction projects honestly, pricing disaster risk properly, and supporting local housing and transport access.
Conclusion
The number worth sitting with is not the 60.4% of urban residents with public transport access. That gain, after all, is real. The more telling number is that open public space kept shrinking while cities kept growing outward.
Singapore shows what decades of disciplined public housing investment can do. South Sudan and Mali show what happens when urbanization outruns governance capacity. The sprawl reversal since 2020 shows that even the best-tracked trends can turn without warning.
None of that gets solved by good intentions. It gets solved by projects that are modeled honestly before ground is broken.
Building a financial model for a real estate or urban infrastructure project? Oak’s financial modeling services can help. Oak builds the numbers behind the city.