10 KPIs for the CFO: Track your performance
Introduction: Why CFO KPIs Define Financial Leadership
In today’s high-stakes business environment, a Chief Financial Officer carries far more responsibility than overseeing the books. Modern CFOs are strategic leaders, risk managers, capital allocators, and performance stewards all at once. The sheer breadth of this role makes it essential to have a concise, reliable set of Key Performance Indicators (KPIs) that translate complex financial realities into actionable intelligence.
KPIs for a CFO serve two purposes simultaneously. First, they provide an objective measure of how the finance function itself is performing. Second, they function as a diagnostic lens for the entire organization, revealing where cash is being created or consumed, where risk is accumulating, and where strategic opportunities remain untapped.
According to Oracle’s CFO research, modern CFOs must deliver a clear point of view on which metrics best capture company performance and then build a strategy for tracking and communicating those metrics to drive improvement across the business. This guide explores the ten most critical KPIs a CFO should monitor, explaining what each measures, how to calculate it, what benchmarks to target, and why it is indispensable to financial leadership.
The 10 Essential CFO KPIs
KPI 1: Current Accounts Receivable and Payable
Formula:
- AR Turnover = Net Credit Sales / Average Accounts Receivable
- AP Turnover = Total Purchases / Average Accounts Payable
Industry Benchmark: AR Days of 30 to 45 days for most industries. AP Days of 30 to 60 days depending on supplier terms.
These two metrics sit at the heart of working capital management. Accounts Receivable tracks how efficiently a company collects money owed by customers, while Accounts Payable reflects how strategically it manages payments to suppliers. Together, they determine the rhythm of the company’s cash conversion cycle. A CFO who masters this balance can significantly reduce financing costs and improve liquidity without needing additional capital.
Imbalances between AR and AP are among the most common causes of cash crunches in otherwise profitable businesses. Monitoring this KPI monthly allows the CFO to spot collection slowdowns early and negotiate better supplier terms proactively. The goal is to collect faster than you pay out, creating a natural float that funds operations.
Strategic action: CFOs should benchmark AR Days and AP Days against direct competitors quarterly and set internal improvement targets of 2 to 3 days per year as a baseline.
KPI 2: Debt to Equity Ratio
Formula: Debt to Equity Ratio = Total Liabilities / Total Shareholders’ Equity
Industry Benchmark: Below 2.0 for most industries. Capital-intensive sectors such as utilities or manufacturing may carry higher ratios of 3.0 to 5.0.
This ratio measures the proportion of company financing that comes from creditors versus shareholders. A high ratio signals heavy reliance on debt, which amplifies financial risk particularly during economic downturns or rising interest rate environments. A low ratio may indicate an overly conservative capital structure that is not optimizing returns for shareholders.
The CFO uses this metric to calibrate the right financing mix for the company’s growth stage and risk tolerance. Lenders, investors, and credit rating agencies scrutinize this ratio closely. Keeping it within an acceptable range preserves the company’s access to affordable financing and protects credit ratings. If the ratio is trending upward, the CFO must evaluate whether new debt is funding productive assets or simply sustaining operating losses.
Strategic action: Review the Debt to Equity Ratio before any major capital raise or acquisition. It directly determines how much additional debt capacity the company holds.
KPI 3: Days Sales Outstanding (DSO)
Formula: DSO = (Accounts Receivable / Total Credit Sales) x Number of Days
Industry Benchmark: Best-in-class DSO is typically under 30 days. Industry average ranges from 40 to 55 days across most sectors.
Days Sales Outstanding quantifies the average number of days a company takes to collect payment after a sale has been made. A rising DSO is a warning signal: cash is sitting in unpaid invoices rather than available for operations or investment. Conversely, a falling DSO indicates stronger collection practices and better-negotiated payment terms.
CFOs use DSO trends to benchmark the effectiveness of the credit and collections function and to project near-term cash availability. For a company with USD 100 million in annual revenue, a one-day improvement in DSO frees approximately USD 274,000 in cash. The compounding effect of consistent DSO reduction across multiple years is substantial and directly reduces the need for working capital financing.
Strategic action: Set DSO targets by customer segment and sales channel. Large enterprise customers often carry longer DSO than smaller accounts, so segment-level tracking reveals where collections effort should be concentrated.
KPI 4: Free Cash Flow (FCF)
Formula: Free Cash Flow = Operating Cash Flow – Capital Expenditures
Industry Benchmark: Positive FCF is the baseline expectation. An FCF margin (FCF divided by Revenue) above 10% is considered strong across most industries.
Free Cash Flow represents the cash a business generates after accounting for the capital expenditures needed to maintain or expand its asset base. It is the clearest measure of a company’s ability to create value, repay debt, fund acquisitions, pay dividends, or invest in innovation. Unlike net profit, FCF is far harder to manipulate with accounting adjustments, making it the preferred metric among sophisticated investors and analysts when assessing true financial health.
A company can report strong net income while generating negative FCF if it is consuming excessive capital or poorly managing working capital. CFOs who prioritize FCF generation build organizations that are financially resilient, self-funding, and attractive to both investors and potential acquirers.
Strategic action: Model FCF scenarios across different capex levels and growth assumptions when presenting the annual budget. This gives the board a clear view of the trade-off between investment intensity and cash generation.
KPI 5: Net Profit Margin
Formula: Net Profit Margin = (Net Income / Revenue) x 100
Industry Benchmark: Healthy margins vary widely by industry. Software companies may target 20 to 30 percent. Retail and manufacturing often operate at 2 to 8 percent. Consistent improvement over time is the key indicator.
Net Profit Margin expresses what percentage of each dollar of revenue is retained as profit after all expenses, taxes, and interest have been accounted for. It is the single most comprehensive measure of a company’s profitability and management efficiency. For CFOs, this metric is central to budgeting, cost control decisions, and strategic planning.
Declining margins often signal cost structure problems, pricing pressure, or revenue quality issues that require immediate attention. Net profit margin directly determines how much capital is available for reinvestment in growth. A CFO who manages margin discipline while investing intelligently for future revenue creates durable shareholder value. Margin analysis should be performed at both the total company level and the business unit or product line level to identify which parts of the business are subsidizing others.
Strategic action: Track net profit margin monthly against budget and prior year. When margin deteriorates by more than 1 percentage point, initiate a structured cost and revenue quality review before the trend compounds.
KPI 6: Operating Cash Flow (OCF)
Formula: OCF = Net Income + Non-Cash Charges + Changes in Working Capital
Industry Benchmark: OCF should consistently exceed net income over time. An OCF-to-Net Income ratio above 1.0 is a positive indicator of earnings quality.
Operating Cash Flow measures the cash generated purely from a company’s core business operations, excluding financing and investment activities. It answers the fundamental question: Can this business fund itself from its own operations? A company can report strong net profits while simultaneously suffering from cash flow problems if its working capital is poorly managed. OCF strips away these distortions and gives the CFO a clear view of operational cash-generating capability.
OCF is the foundation of all cash flow planning. It determines the company’s capacity to cover short-term liabilities, service debt, and make strategic investments without relying on external financing. An OCF that is consistently lower than net income may indicate aggressive revenue recognition, poor collections, or rising inventory that will eventually require write-downs.
Strategic action: Compare OCF to net income on a trailing twelve-month basis. A persistent gap between the two warrants a deep dive into working capital dynamics and revenue recognition policies.
KPI 7: Payment Error Rate
Formula: Payment Error Rate = (Number of Erroneous Payments / Total Payments Processed) x 100
Industry Benchmark: Best-in-class finance operations target a payment error rate below 0.5 percent. Many organizations still operate in the 1 to 2 percent range.
This operational KPI measures the frequency of errors in the company’s payment processing, including duplicate payments, incorrect amounts, payments to wrong vendors, or payments made against fraudulent invoices. While often overlooked in favor of higher-level financial metrics, payment error rate has a direct impact on cash flow, vendor relationships, and the cost of the finance function.
A 1 percent payment error rate on USD 50 million of annual payments represents USD 500,000 in potentially misdirected funds. High error rates also increase audit risk and expose the organization to potential fraud. Tracking and minimizing this KPI protects cash and signals the maturity of the finance function. Automation of accounts payable processing is the most effective lever for reducing this metric.
Strategic action: Conduct a semi-annual payment audit to identify recurring error patterns. Investing in AP automation tools typically reduces payment error rates by 60 to 80 percent and pays back within 12 months through recovered funds and reduced processing costs.
KPI 8: Quick Ratio (Acid Test)
Formula: Quick Ratio = (Cash + Short-Term Investments + Accounts Receivable) / Current Liabilities
Industry Benchmark: A Quick Ratio of 1.0 or higher is generally considered healthy. Ratios above 1.5 indicate strong short-term financial health.
The Quick Ratio is a stringent test of short-term liquidity. Unlike the current ratio, it excludes inventory and other assets that cannot be rapidly converted to cash, giving a more conservative and realistic view of whether the company can meet its immediate obligations. A Quick Ratio below 1.0 raises a red flag that the company may struggle to cover its short-term liabilities without selling inventory or securing additional financing.
Lenders and investors use the Quick Ratio as a leading indicator of financial distress. CFOs who maintain a healthy Quick Ratio retain strategic flexibility, especially during periods of market volatility or unexpected disruption. In economic downturns, companies with strong Quick Ratios can continue operating and even acquire distressed competitors while those with weak ratios face survival challenges.
Strategic action: Monitor the Quick Ratio monthly and set a board-level floor (typically 1.0) below which the CFO is required to present a remediation plan. This creates accountability before a liquidity issue becomes a crisis.
KPI 9: Return on Equity (ROE)
Formula: ROE = (Net Income / Average Shareholders’ Equity) x 100
Industry Benchmark: A consistent ROE above 15 percent is widely considered strong. The S&P 500 median ROE typically falls in the 14 to 18 percent range.
Return on Equity measures how effectively management is using shareholders’ capital to generate profits. It is one of the most closely watched metrics by investors and board members because it directly quantifies management’s ability to create value from the capital entrusted to them. CFOs use ROE to evaluate strategic decisions, from capital allocation choices to dividend policy, and to benchmark the company’s performance against industry peers.
A declining ROE over multiple periods signals that growth is not generating proportional returns. This prompts CFOs to scrutinize capital efficiency and potentially restructure the balance sheet or business mix. Conversely, a rising ROE validates that strategic investments are creating value proportional to the capital deployed and gives management credibility in investor conversations.
Strategic action: Decompose ROE using the DuPont formula (Net Profit Margin x Asset Turnover x Equity Multiplier) to identify whether changes in ROE are driven by profitability, efficiency, or leverage. Each driver requires a different strategic response.
KPI 10: Working Capital
Formula:
- Working Capital = Current Assets – Current Liabilities
- Working Capital Ratio = Current Assets / Current Liabilities
Industry Benchmark: A Working Capital Ratio of 1.2 to 2.0 is considered healthy for most businesses. Below 1.0 indicates potential liquidity risk.
Working Capital is the lifeblood of daily business operations. It represents the net resources available to fund the company’s short-term operating cycle, from purchasing inventory and paying suppliers to collecting from customers. Positive working capital means the company can meet its near-term obligations comfortably. Negative working capital signals potential liquidity risk even when the income statement looks healthy.
CFOs monitor this metric closely because changes in working capital directly consume or generate cash, often preceding visible problems in the income statement by one or two quarters. Effective working capital management is often the difference between a company that grows sustainably and one that finds itself in a cash crisis despite strong sales. CFOs who optimize working capital free up capital that would otherwise be trapped in the operating cycle.
Strategic action: Build a rolling 13-week cash flow forecast that tracks working capital movements week by week. This provides early warning of liquidity pressure and eliminates surprises.
Building an Effective CFO KPI Dashboard
Tracking ten KPIs is only valuable if the data is accurate, timely, and presented in a way that enables rapid decision-making. A well-designed CFO dashboard should achieve the following:
- Display real-time or near-real-time data rather than relying on month-end reports
- Show trends over time, not just point-in-time snapshots, so that directional signals are visible early
- Include industry benchmarks alongside internal results for meaningful context
- Highlight variances from targets with clear visual indicators that draw attention to problems
- Be accessible to the full executive team, not just the finance function
Modern CFO dashboards leverage integrated ERP platforms, business intelligence tools, or dedicated financial performance software. The critical requirement is that the data feeding these dashboards is clean, consistent, and updated frequently enough to support timely decisions. A dashboard that is accurate but two weeks old is not a management tool; it is a historical record.
Recommended KPI Review Cadence
| Frequency | KPIs to Review | Purpose |
| Weekly | DSO, OCF, Payment Error Rate | Operational pulse check and cash position |
| Monthly | AR/AP, Working Capital, Quick Ratio, Net Profit Margin | Full liquidity and profitability review |
| Quarterly | FCF, Debt to Equity, ROE | Strategic and investor-facing performance review |
| Annually | All 10 KPIs vs. targets and benchmarks | Full-year assessment and goal-setting for the next period |
How These KPIs Interconnect
The ten KPIs in this guide do not operate in isolation. They form an interconnected financial health system where a shift in one metric typically creates ripple effects across others.
A rising DSO increases Accounts Receivable and reduces Operating Cash Flow, which in turn pressures Working Capital and may force the company to draw on credit lines, increasing the Debt to Equity Ratio.
Strong Free Cash Flow gives the CFO room to retire debt, which improves the Debt to Equity Ratio, reduces interest costs, and ultimately expands Net Profit Margin.
Improving Net Profit Margin while holding the equity base stable drives Return on Equity higher, signaling to investors that management efficiency is improving without relying on additional leverage.
Reducing Payment Error Rate, while operational in nature, directly protects cash and reduces the hidden costs embedded in Accounts Payable management, contributing to stronger Operating Cash Flow.
Understanding these interconnections allows a CFO to diagnose root causes rather than treating symptoms. When one KPI deteriorates, the CFO can trace the cascading effects and intervene at the source rather than applying short-term fixes that mask a deeper structural problem.
Frequently Asked Questions
What is a CFO KPI and why does it matter?
A quantifiable metric that evaluates financial health and guides strategic decisions. Without defined KPIs, financial management becomes reactive and problems surface too late.
How many KPIs should a CFO track at once?
Between 8 and 15 is the recommended range. The ten in this guide cover liquidity, profitability, efficiency, leverage, and operational accuracy, a balanced set for most organizations.
What is the most important KPI for a CFO? Free Cash Flow is most commonly cited, but the answer depends on context. DSO matters most when cash is tight, ROE when communicating with investors, and Net Profit Margin when budgeting.
What is a healthy Debt to Equity Ratio?
Below 2.0 for most industries. Capital-intensive sectors like utilities can carry 3.0 to 5.0. Technology and services firms typically stay well below 1.0.
What is the difference between Operating Cash Flow and Free Cash Flow?
OCF is cash from operations before capex. FCF subtracts capital expenditures to show what remains after the business maintains its asset base. OCF measures efficiency; FCF measures sustainability.
Why should a CFO track Payment Error Rate?
A 1 percent error rate on USD 50 million in payments equals USD 500,000 in misdirected funds. Tracking it exposes fraud risk and signals the maturity of the finance function.
How does Return on Equity help a CFO make strategic decisions?
ROE shows whether growth is generating adequate returns on shareholder capital. A declining ROE prompts capital allocation reviews; a rising ROE validates that investments are creating value.
Conclusion
The role of the modern CFO has evolved beyond managing the balance sheet. Today’s financial leaders are expected to be strategic advisors, risk analysts, and performance architects. The ten KPIs covered in this guide provide the quantitative foundation for that expanded mandate.
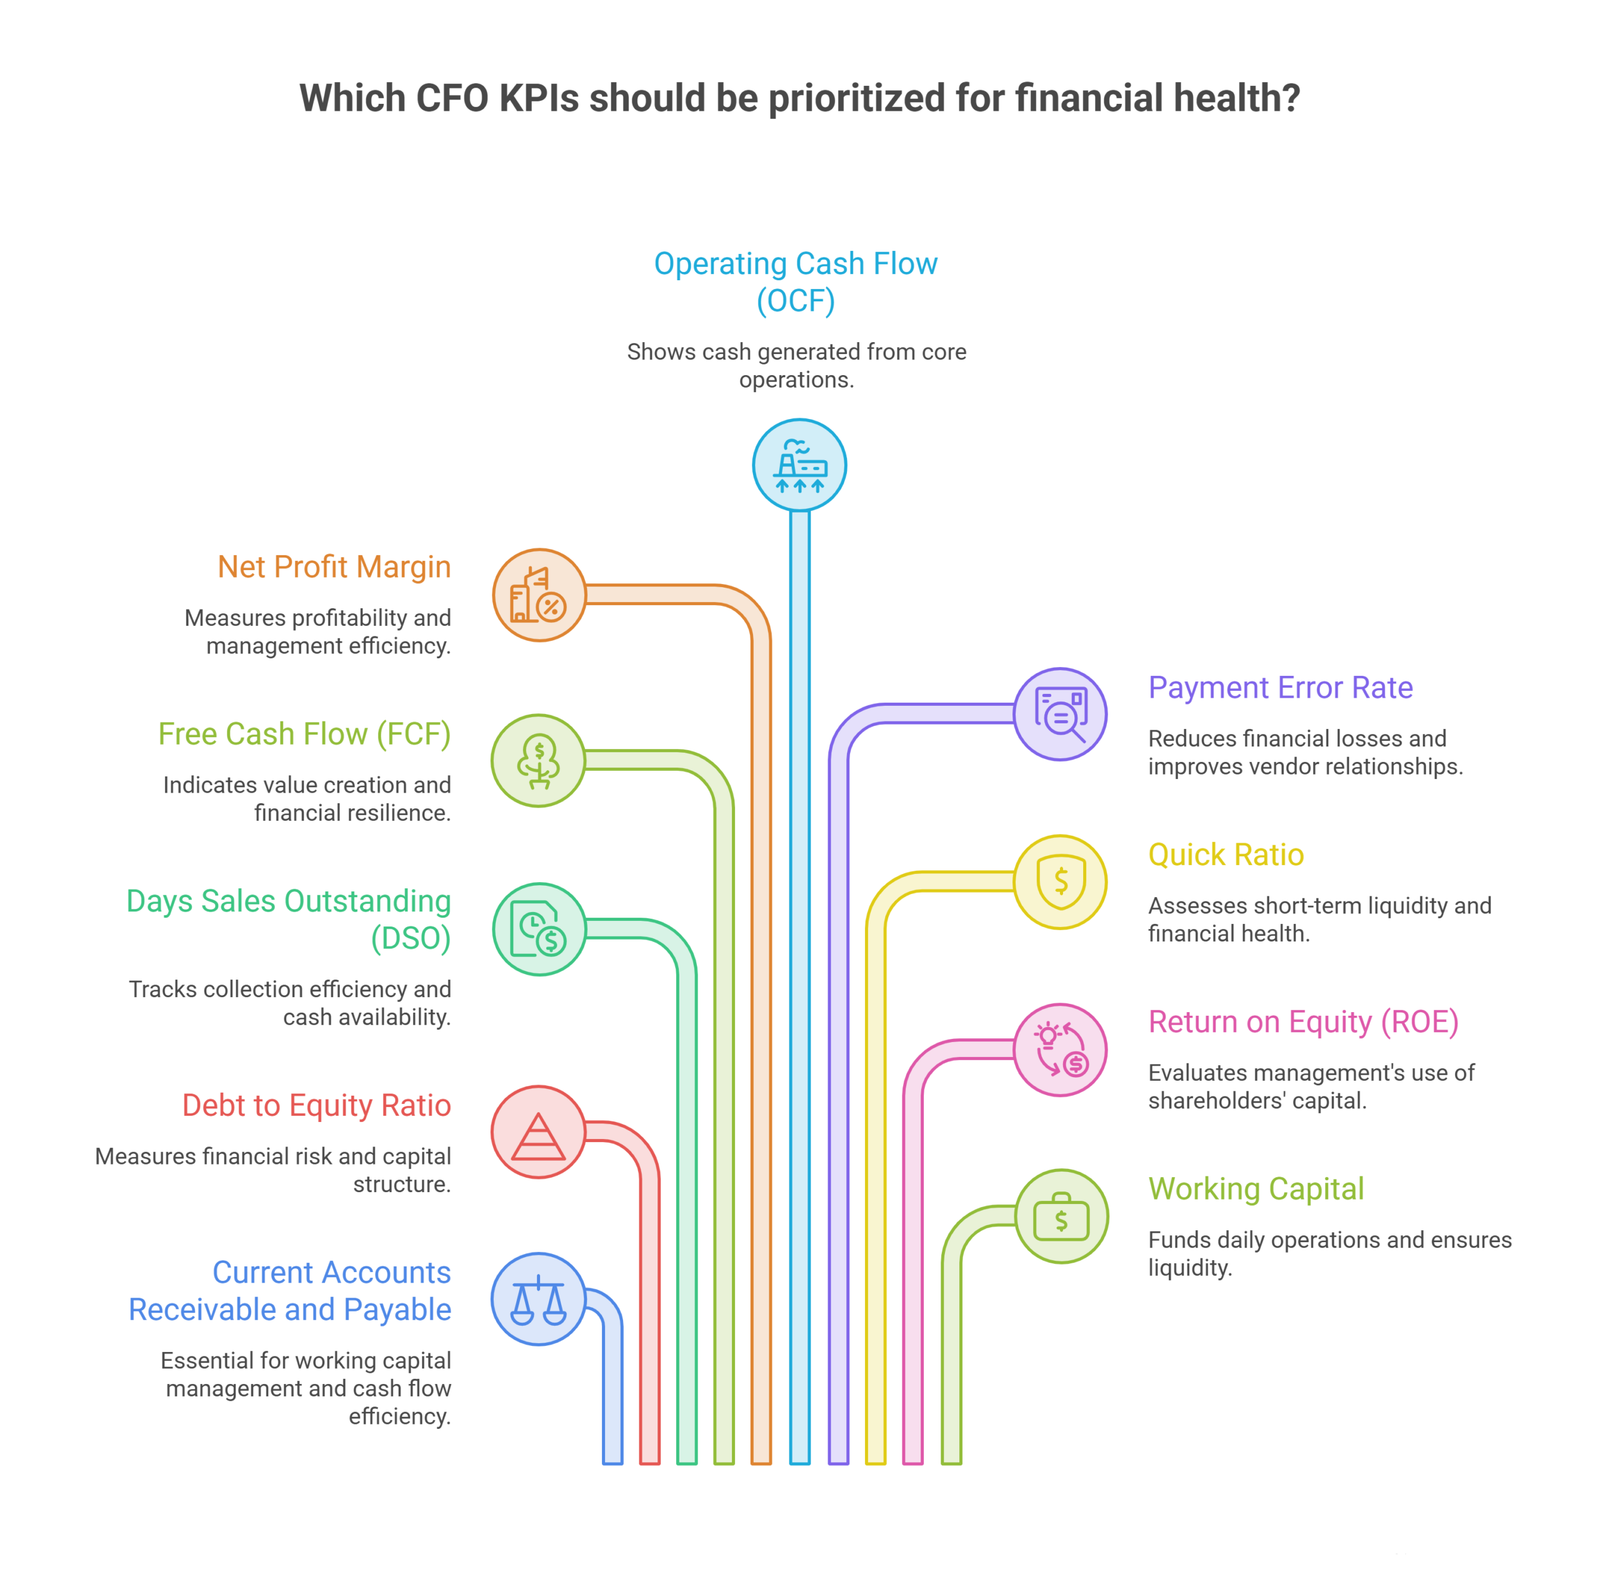
Accounts Receivable and Payable management, Debt to Equity, Days Sales Outstanding, Free Cash Flow, Net Profit Margin, Operating Cash Flow, Payment Error Rate, Quick Ratio, Return on Equity, and Working Capital together paint a complete picture of financial health. No single metric tells the whole story, but tracked consistently and communicated clearly, they equip a CFO to lead with confidence, anticipate challenges, and drive sustainable value creation.
CFOs who build rigorous KPI tracking into their operating rhythm do not simply report on performance. They shape it.
In a high-stakes economy, a single day’s variance in DSO can trap millions in working capital.
Your board expects an aggressive, self-funding strategy, a resilient Quick Ratio, and an optimized capital structure. Don’t let operational friction or payment inefficiencies drag down your Free Cash Flow margin.
Partner with Oak Business Consultant. Our corporate finance experts help executive teams stress-test financial structures, clean up reporting frameworks, and implement advanced working capital optimization models that maximize enterprise value. Schedule a free strategic CFO-to-CFO consultation.