Highly In-Demand Financial Models for Tourism Industry
Top Financial Models Essential for the Tourism Sector
Tourism demand can turn within a single season. Fuel prices, airfares, regional conflict and currency moves can stall global arrivals, even while some regions keep growing. Forecasts get cut mid-year, and a business that planned on the old number feels it first.
A lender reading those numbers will ask one question: what happens to your business if visitors fall short? A tourism financial model has to answer with monthly cash, not annual averages. This guide shows how to build one, from seasonality to stress tests, for hotels, resorts, buses, tour operators and medical tourism ventures.
What demand shocks mean for your assumptions
Global figures hide wide regional gaps. In a weak period, one region can lose a fifth of its arrivals while another keeps growing. Your destination’s own data matters more than the world average.
Costs move too. Higher oil prices and inflation push up airfares and push some travelers toward closer, cheaper trips. Three changes follow for the model:
- Split visitors into domestic and international groups. Airfares and border rules hit them differently.
- Add a fuel and transport cost line that can be flexed, especially for tour operators and bus routes.
- Base growth on your destination’s data. Use published global forecasts only as a cross-check.
Why seasonality changes how the model is built
Most tourism businesses earn their year in a few months. A flat twelve-month forecast spreads that income evenly. A slow month then looks profitable on paper while the bank balance falls.
Seasonality also hits segments unevenly. A peer-reviewed study of Norwegian hotels by Zhang, Xie and Sikveland found that the effect depends on the market segment and the destination. A seasonal assumption copied from another business can therefore mislead.
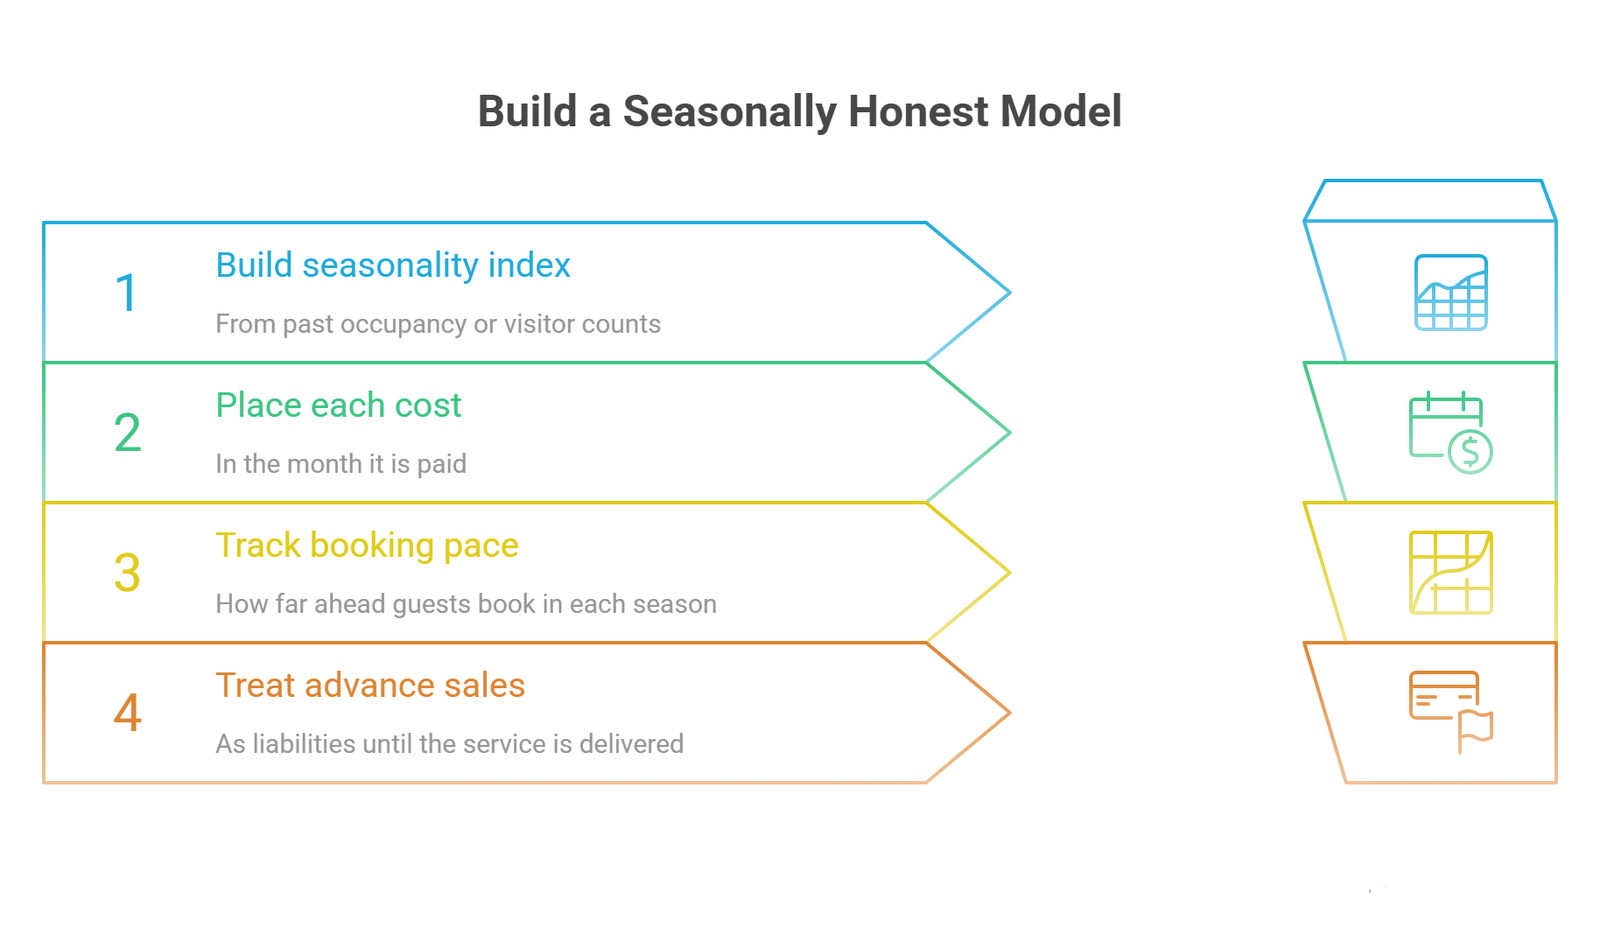
Four steps keep the model honest:
- Build a monthly seasonality index from past occupancy or visitor counts. A new venture can borrow the pattern from a comparable local business.
- Place each cost in the month it is paid. Pre-season hiring, marketing and maintenance land before the revenue does.
- Track booking pace. Know how far ahead guests book in each season, so the model shows when cash arrives, not only when the trip happens.
- Treat advance sales as liabilities. Deposits and season passes bring cash early, but they are also obligations if a trip is cancelled or a season is cut short. Record them as liabilities until the service is delivered.
A worked example: profit on paper, a cash gap in practice
The numbers below are illustrative, not client data. They show why monthly cash matters. Take a small coastal tour operator with $600,000 in annual revenue. Fixed costs run $30,000 a month and variable costs take 30% of revenue. March adds $20,000 of pre-season marketing and maintenance.
| Season | Months | Revenue per month | Net cash per month | Season total |
| Low (Jan to Mar, Nov to Dec) | 5 | $28,000 | -$10,400 | -$52,000 |
| Shoulder (Apr, May, Sep, Oct) | 4 | $40,000 | -$2,000 | -$8,000 |
| Peak (Jun to Aug) | 3 | $100,000 | +$40,000 | +$120,000 |
| Pre-season spend (March) | 1 | n/a | -$20,000 | -$20,000 |
| Full year | 12 | $600,000 | +$40,000 |
The annual view shows a 40,000profit.Themonthlyviewtellsadifferentstory.StartingJanuarywithnocash,thebalancereachesitslowestpointattheendofMay,atabout-55,200. The business needs that much funding before the first peak-season booking arrives.
Now cut peak revenue by 20%. Peak months then net $26,000 instead of 40,000.Theyearendswithcashofabout-2,000, so the profit disappears. The May low point does not move at all, because the shortfall arrives after it. That is why lenders test the weakest stretch first.
How much cash cushion to plan for
The lowest month in the cash forecast sets the minimum funding need. Size the cushion in three steps:
- Run the monthly forecast from the first day of the financial year, with realistic opening cash.
- Find the lowest cumulative cash balance in the base case. In the example above, that is $55,200.
- Add a buffer for a weak season. Many owners add at least one extra month of fixed costs, here $30,000, and test a delayed start on top.
The result is a funding target of about $85,000 in this example. It can come from equity, a seasonal credit line or a mix. Arrange a credit line before the slow months, not during them, because lenders price a request made in a cash squeeze much higher.
Ways to flatten the curve
A model should also test the actions that shrink the gap. Each one below can become a switch in the forecast:
- Shoulder-season pricing. Early-booking offers move demand into quieter months and bring cash in sooner.
- Counter-seasonal products. Winter events, corporate groups and local residents can fill rooms and seats in the low months.
- Flexible staffing. Keep a small core team year-round and add seasonal staff on short contracts.
- Payment terms. Collect deposits earlier and negotiate supplier payments closer to the travel date.
- Marketing timing. Spend ahead of booking windows rather than spreading the budget evenly across twelve months.
Model design by tourism segment
Each segment has its own revenue driver and its own cash trap. The sections below show what to build first.
Hotels and resorts: start with RevPAR, then go to profit
Revenue per available room, or RevPAR, equals occupancy times average daily rate. Lenders look at it because a single room revenue total hides which lever failed. Occupancy can fall while rate rises, or the reverse.
RevPAR stops at room revenue. A hotel model also needs food and beverage, events and spa income, departmental costs and gross operating profit. Break-even occupancy comes from this calculation:
Break-even occupancy = fixed costs ÷ (rooms × days open × (average daily rate minus variable cost per occupied room))
Oak’s hotel and resort financial model builds from occupancy and rate, so a weak month shows which of the two caused it. For a worked case with several properties, see Oak’s eco resort financial model case study.
Ski resorts and weather-dependent attractions

Ski resorts earn most of their income in a short winter window. They pay for lifts, insurance and year-round staff all year. Snowmaking and seasonal labor add costs only in season. Season pass sales bring cash before opening, which eases the pre-season gap. The model should still recognize that revenue as the season runs.
Weather is the main downside risk. Include a poor-season case, such as a late start or a shortened winter. Then check whether pass revenue still covers fixed costs. Copying nearby resorts’ ticket prices is a common error, because it ignores the visitor count your own fixed costs require. A ski resort financial model can test price against several visitor scenarios.
Sightseeing buses and visitor attractions

Capacity sets the ceiling. A 40-seat bus cannot sell 60 tickets, however strong demand looks. A bottom-up forecast starts with seats or entries per departure, the number of departures and an expected fill rate by month.
Revenue often comes from tickets, parking and spending at stops, so each stream needs its own line. Fuel, maintenance and permits are the main costs, and fuel carries the oil-price pressure. Demand here tends to follow tourist calendars and local events more than weather. Oak’s sightseeing bus financial model maps these streams separately.
Travel agencies and tour operators

These businesses earn thin, fragmented margins from service fees, supplier commissions and markups on packaged trips. Commission rates often vary by supplier and booking type, so one flat percentage misstates revenue. The model should carry each tier on its own line.
Cash timing matters as much as margin. Customers often pay deposits months ahead and suppliers get paid later. That float looks like profit until refunds and cancellations arrive. Tie marketing spend to bookings by comparing customer acquisition cost with average booking value. A travel agency financial model that separates commission income from fee income shows which service lines pay their way.
Medical tourism: long sales cycles and cross-border risk

Medical tourism pays well per patient, but trust takes time and money to build. Patients choose providers in another country, so acquisition costs run higher and sales cycles longer than for ordinary trips. The revenue build should include facilitation fees, partner hospital agreements and a realistic gap between first inquiry and treatment date.
Currency swings and differing regulations add risk when patients and providers sit in different countries. A medical tourism model should include an exchange-rate sensitivity for that reason.
Stress tests every tourism model needs
| Scenario | What to change in the model | What it reveals |
| Visitor shortfall | Cut visitor or booking volume in the peak months | Whether fixed costs and loan payments survive a weak season |
| Cost spike | Raise fuel, transport and energy costs | The margin hit for buses, tours and resorts |
| Mix shift | Move visitors from international to domestic, with lower spend | Whether current pricing still covers costs |
| Currency move | Change the exchange rate on foreign-currency revenue and costs | Exposure for medical tourism and agencies |
| Late opening | Delay opening by one or two months | Extra interest and idle staff cost |
| Cancellation wave | Refund a share of advance deposits and passes | Whether early cash is really yours |
Run each case against monthly cash, not just annual profit. The lowest cash month shows how much working capital or credit line the business needs.
Frequently Asked Questions
How fast should a tourism model assume visitors will grow?
Start with local data for your destination. Published global forecasts from bodies such as UN Tourism work as a cross-check, but regions differ widely. Run a flat-visitor case next to the base case.
Should a tourism model be monthly or annual?
Monthly for at least the first two to three years, then annual. Annual views hide the slow months where cash runs short.
How do deposits and season passes appear in the model?
As cash when received and as a liability until the service is delivered. Revenue follows the delivery date. That stops one strong booking month from overstating profit.
Does RevPAR apply outside hotels?
The metric is hotel-specific, but the idea is not. Revenue per unit of available capacity works for buses, attractions and tours. Use revenue per seat or per departure.
Why model domestic and international visitors separately?
They book at different times, pay different prices and react to different shocks, such as airfares or border rules. One blended visitor figure hides that.
How far out should the projection run?
Three to five years suits most lenders, with the first year monthly. A resort with a multi-year build may need ten years.
How much working capital does a seasonal tourism business need?
Enough to cover the lowest point of the monthly cash forecast, plus a buffer for a weak season. Build the forecast first. The deepest cumulative deficit, not the annual profit, sets the number.
Conclusion
Tourism funding decisions often turn on the weakest month rather than the best one. A model that shows that month honestly, with a cash cushion sized to cover it, shortens the funding conversation. Building it before the lease, the fleet or the first deposit is the cheapest time to learn that the plan needs changes.
Oak builds financial models for hotels, attractions, tour operators and medical tourism ventures. Owners who need ongoing oversight of seasonal cash can add Oak’s virtual CFO services on a part-time basis. They cover forecasting, cash management and investor reporting.