SDG 12: Responsible Consumption and 1 Billion Meals Wasted Every Day
SDG 12: responsible consumption and production, ten years in
The world wasted 1.05 billion tonnes of food in 2022 alone. That works out to more than a billion meals thrown away every single day. Households caused 60% of it.
That is the finding at the center of the UN’s 2026 tracking data, a decade after SDG 12 was adopted. Material consumption has kept climbing too. E-waste is piling up faster than anyone can recycle it.
Some numbers have moved the right way. Fossil fuel subsidies fell for a second straight year. Corporate sustainability reporting has nearly quadrupled since 2016.
This guide covers what SDG 12 actually commits the world to. It covers where the 2026 reporting shows progress standing, country by country. That ranges from nations building genuine circular economies to nations absorbing the world’s discarded electronics. It also covers what businesses can realistically do about it.
What is SDG 12
SDG 12 is formally titled “Ensure sustainable consumption and production patterns.” It is the twelfth of the 17 Sustainable Development Goals. All 193 UN member states adopted it in 2015, as part of the 2030 Agenda.
The goal covers the full life cycle of a product. That means resource extraction, corporate reporting, government procurement, chemical and waste management, food loss, and consumer awareness. It applies to businesses and governments as much as to households.
SDG 12 also carries a built-in tension. Wealthier countries usually lead on policy instruments and sustainability reporting. They also tend to consume, waste, and discard far more per person than poorer countries do. That contradiction runs through nearly every part of this goal’s data.
The official targets and indicators behind SDG 12
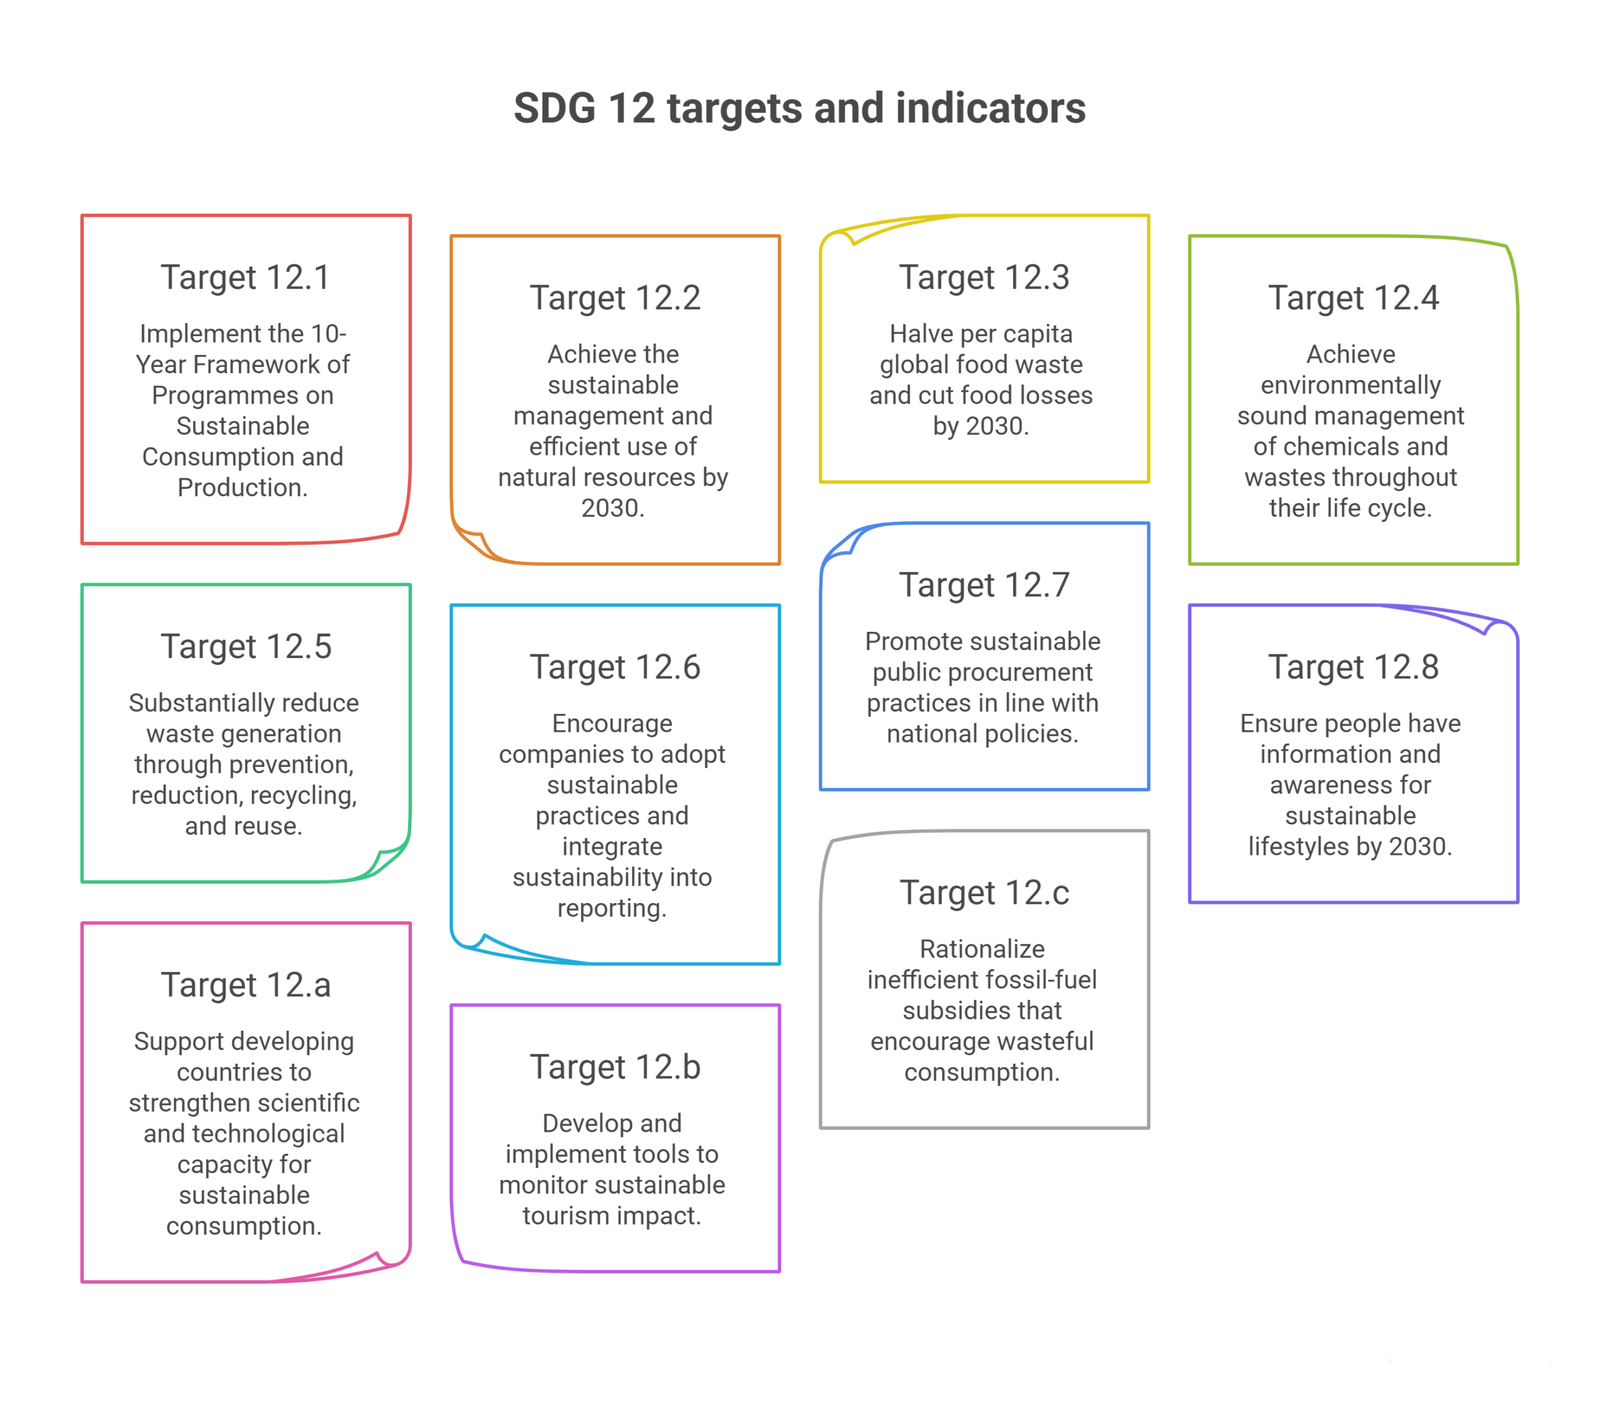
SDG 12 breaks down into 11 official targets. Eight are outcome targets, numbered 12.1 through 12.8. Three are means-of-implementation targets, numbered 12.a through 12.c.
Together they are tracked through 13 indicators, as set out on the UN’s SDG 12 page.
Target 12.1: Implement the 10-Year Framework of Programmes on Sustainable Consumption and Production. Developed countries take the lead. Tracked through the number of countries with relevant policy instruments in place.
Target 12.2: Achieve the sustainable management and efficient use of natural resources by 2030. Tracked through material footprint and domestic material consumption, both overall and per capita.
Target 12.3: Halve per capita global food waste at the retail and consumer level by 2030. Also cut food losses along production and supply chains. Tracked through the food loss index and the food waste index.
Target 12.4: Achieve environmentally sound management of chemicals and wastes throughout their life cycle. Tracked through compliance with international hazardous waste agreements, and hazardous waste generated and treated per capita.
Target 12.5: Substantially reduce waste generation through prevention, reduction, recycling, and reuse. Tracked through the national recycling rate and tons of material recycled.
Target 12.6: Encourage companies, especially large and transnational ones, to adopt sustainable practices. This includes integrating sustainability into their regular reporting. Tracked through the number of companies publishing sustainability reports.
Target 12.7: Promote sustainable public procurement practices in line with national policies. Tracked through the number of countries implementing sustainable procurement policies and action plans.
Target 12.8: Ensure people everywhere have the information and awareness for sustainable lifestyles by 2030. Tracked through how deeply sustainability education is built into national curricula and teacher training.
Target 12.a: Support developing countries to strengthen their scientific and technological capacity for sustainable consumption. Tracked through installed renewable energy-generating capacity, in watts per capita.
Target 12.b: Develop and implement tools to monitor sustainable tourism, including its economic and environmental impact. Tracked through the use of standardized tourism sustainability accounting tools.
Target 12.c: Rationalize inefficient fossil-fuel subsidies that encourage wasteful consumption. This includes restructuring taxation and phasing out harmful subsidies where they exist. Tracked through the amount of fossil-fuel subsidies per unit of GDP.
Where global progress actually stands
The UN’s 2026 reporting describes sustainable consumption as advancing on policy but lagging badly on implementation. That gap between adopting a rule and actually meeting it defines this goal more than any other.
Between 2019 and 2025, 75 countries reported 609 policy instruments supporting sustainable consumption. That is a 16% increase from the previous reporting period, according to UN DESA’s Goal 12 tracker. Eight countries reported for the first time, a sign of broadening engagement.
Material use keeps rising regardless. Global domestic material consumption grew 23.3% between 2015 and 2022, reaching 14.2 tonnes per capita. Material footprint, the raw materials a country’s economy actually demands, grew 21.3% over the same period.
Food waste has barely moved. Food lost after harvest sat at 13.3% in 2023, up slightly from 13.0% in 2015. That 1.05 billion tonnes was wasted at retail, food service, and household level in 2022 alone. It equals 19% of all food available to consumers.
The cost is not just wasted food. Food loss and waste together account for up to 10% of global greenhouse gas emissions. They also cost the world over $1 trillion a year.
E-waste is growing faster than recycling capacity can keep up. Global e-waste hit 65 million tonnes in 2023, or 8.1 kg per person. Only 15.5 million tonnes, less than a quarter, was formally recycled.
Corporate behavior has genuinely shifted. Ninety-six percent of the world’s 250 largest companies by revenue now publish sustainability reports, up from 64% in 2015. The number of sustainability reports quadrupled between 2016 and 2023.
Public procurement policy is spreading too. Fifty-four countries had a compliant sustainable procurement score in 2025, up from 49 in 2022. The bigger challenge now is implementation, not policy creation.
Fossil fuel subsidies, the target most directly tied to money, fell 10.2% in 2024 to $921 billion. That is down from a 2022 peak of $1.66 trillion. Even so, subsidies remain more than double their 2020 low of $424 billion.
The table below sets out where the core indicators stood as of the most recent reporting.
| Indicator | Baseline | Most recent figure |
| Countries reporting sustainable consumption policy instruments | 63 countries (2019-2023) | 75 countries, 609 instruments (2019-2025) |
| Domestic material consumption per capita | not comparably tracked | 14.2 tonnes (2022), up 23.3% since 2015 |
| Food lost after harvest | 13.0% (2015) | 13.3% (2023) |
| Food wasted at retail, food service, and household level | not comparably tracked | 1.05 billion tonnes (2022), 19% of available food |
| Global e-waste generated | 44 million tonnes (2015, est.) | 65 million tonnes / 8.1 kg per capita (2023) |
| E-waste formally recycled | not comparably tracked | 15.5 million tonnes, roughly 24% (2023) |
| Large companies publishing sustainability reports | 64% (2015) | 96% of top 250 firms (2026) |
| Global fossil fuel subsidies | $424 billion (2020 low) | $921 billion (2024), down from $1.66 trillion in 2022 |
Source: UN DESA, Goal 12 progress reporting; Global E-waste Monitor, UNITAR/ITU.
Countries ranked: from most sustainable to most struggling
SDG 12 does not have one clean access metric the way clean water or sanitation does. The clearest comparison combines material footprint, waste circularity, and who ends up absorbing the world’s discarded goods.
A genuine caution applies here. Low material footprint scores often reflect poverty rather than sustainable choices, and that gets addressed directly in the sections below.
| Country | Standing on SDG 12 | Notes |
| Estonia | Strong circular economy performer | Near-zero landfill rate, top e-waste recycling rate |
| Norway | High consumption, high recovery | Highest e-waste generation per capita, also a top-three recycler |
| Japan | Fast-improving on food waste | Cut food waste 31% in recent national data |
| India | Lowest material footprint among major economies | 3.7 tonnes per capita, reflects low consumption more than policy |
| United States | High consumption, strong reporting | Material footprint around 25 tonnes per capita |
| UAE | High waste generation, weak recovery | Missed its own 75% landfill diversion target |
| Australia | Highest material footprint per capita globally | Around 31 to 35 tonnes per capita, driven by resource exports |
| Ghana | Struggling, receiving the world’s e-waste | Home to Agbogbloshie, the world’s largest informal e-waste site |
Estonia and Norway, the circular economy leaders

Estonia routinely ranks among the world’s best e-waste recyclers, alongside Norway and Iceland. It also sends almost nothing to landfill, a rare combination in Europe.
Estonia runs a deposit return scheme for containers and packaging, similar to Germany and Finland. Countries with these systems, Estonia, Germany, Finland, Sweden, and Norway, consistently top global waste management rankings.
Norway complicates the story in an interesting way. It generates more e-waste per person than any country on Earth, at 26.8 kg per capita. Yet it also ranks among the top three countries for formal e-waste recycling, alongside Estonia and Iceland.
The lesson is straightforward. A well-designed return and collection system, backed by clear national policy, moves the needle faster than voluntary consumer behavior alone. High consumption does not have to mean poor recovery, if the infrastructure is there to catch it.
United States

The United States sits in the middle of this ranking, and for a specific reason. Its material footprint runs around 25 tonnes per person, roughly the same as Japan and the United Kingdom.
That is a high number by global standards. But the US also leads on Target 12.6, corporate sustainability reporting. American firms are heavily represented among the world’s most transparent large companies.
The US case shows a country managing a high footprint reasonably well on the policy side. It has not reduced consumption. It has built strong reporting infrastructure around that consumption instead.
UAE

The UAE ranks below the US on this list, mainly on execution rather than ambition. Its own government set a landfill diversion target under UAE Vision 2021. The goal was to divert 75% of municipal solid waste away from landfills by 2021. It missed that target.
Per capita municipal solid waste generation in the UAE runs at roughly 1.8 to 2.1 kg per day. That is one of the highest rates in the world. Only around 20 to 30% of that waste gets formally recycled, well below what the country’s own policy called for.
The UAE has since set newer, more achievable targets. Abu Dhabi’s waste management authority now aims for 80% landfill diversion by 2030. That sits alongside its Circular Economy Policy and Plastic Pledge. Whether that revised target lands is still an open question.
Australia, and the wealth paradox

Australia has the highest material footprint per capita in the world.
Recent national data puts it at31.1 tonnes per person in 2024, down from a 2010 peak of 37.6 tonnes.
Part of that number reflects Australia’s role as a major resource exporter, not just domestic consumption. Even so, its own circularity rate sits at just 4.3%, below the global average of 6.9%.
Nordic countries make the same point from a different angle. Finland, Sweden, and Denmark top the overall global SDG rankings each year. Yet the same report notes they face real challenges specifically on SDG 12, driven by unsustainable consumption patterns.
Wealth buys strong policy, sustainability reporting, and recycling infrastructure. It does not automatically buy a small footprint. High-income countries generally lead on Target 12.6 and lag on Target 12.2.
India

India’s material footprint sits at just 3.7 tonnes per capita, among the lowest of any major economy. On paper, that looks like the strongest SDG 12 performance in the world.
That number needs a direct caveat. It largely reflects lower average consumption and a lower material standard of living, not superior sustainability policy. Comparing it directly to Australia’s footprint would be misleading.
India did overtake the United States in 2023 on raw material extraction. It became the world’s second-largest extractor in absolute terms, behind only China. Low per-capita numbers and high absolute extraction can be true of the same country at once.
Ghana

Ghana sits at the most difficult end of this ranking. That is not because of its own consumption, but because of everyone else’s. Agbogbloshie in Accra has become the world’s largest informal e-waste dumpsite.
Roughly 50 to 80% of global e-waste flows toward just four destinations: Ghana, China, India, and Nigeria. About 39% of Ghana’s own e-waste generation is processed at Agbogbloshie alone.
Workers there dismantle electronics with no protective equipment. A 2025 study found elevated blood lead levels among workers and nearby residents. Musculoskeletal injury rates run far above those of the general population.
Ghana’s case captures something SDG 12’s country data often hides. A country can score poorly on this goal while barely contributing to the problem that lands on its doorstep.
What organizations and institutions are doing
Sustainable consumption and production runs through a mix of UN bodies, standard-setters, and independent monitoring groups.
UN DESA and the 10-Year Framework
UN DESA compiles the annual Goal 12 progress report used throughout this piece. The UN advances the goal mainly through one flagship initiative. That is the 10-Year Framework of Programmes on Sustainable Consumption and Production Patterns. It helps countries turn policy into national action.
UNEP and the One Planet network
UNEP hosts the SDG 12 Hub, the main technical platform for tracking material footprint, food waste, and chemical management data. The One Planet network connects governments, businesses, and civil society groups implementing the 10-Year Framework on the ground.
UNITAR and the Global E-waste Monitor
UNITAR, together with the ITU and other partners, publishes the Global E-waste Monitor. It is the primary source for country-level e-waste generation and recycling data used in SDG 12 reporting.
The Basel, Rotterdam, Stockholm, and Minamata Conventions
These four international agreements govern hazardous waste and chemicals under Target 12.4. Compliance varies widely. The Montreal Protocol holds a 100% reporting rate. The Basel and Stockholm Conventions sit closer to 50 to 66%.
How businesses can contribute to SDG 12
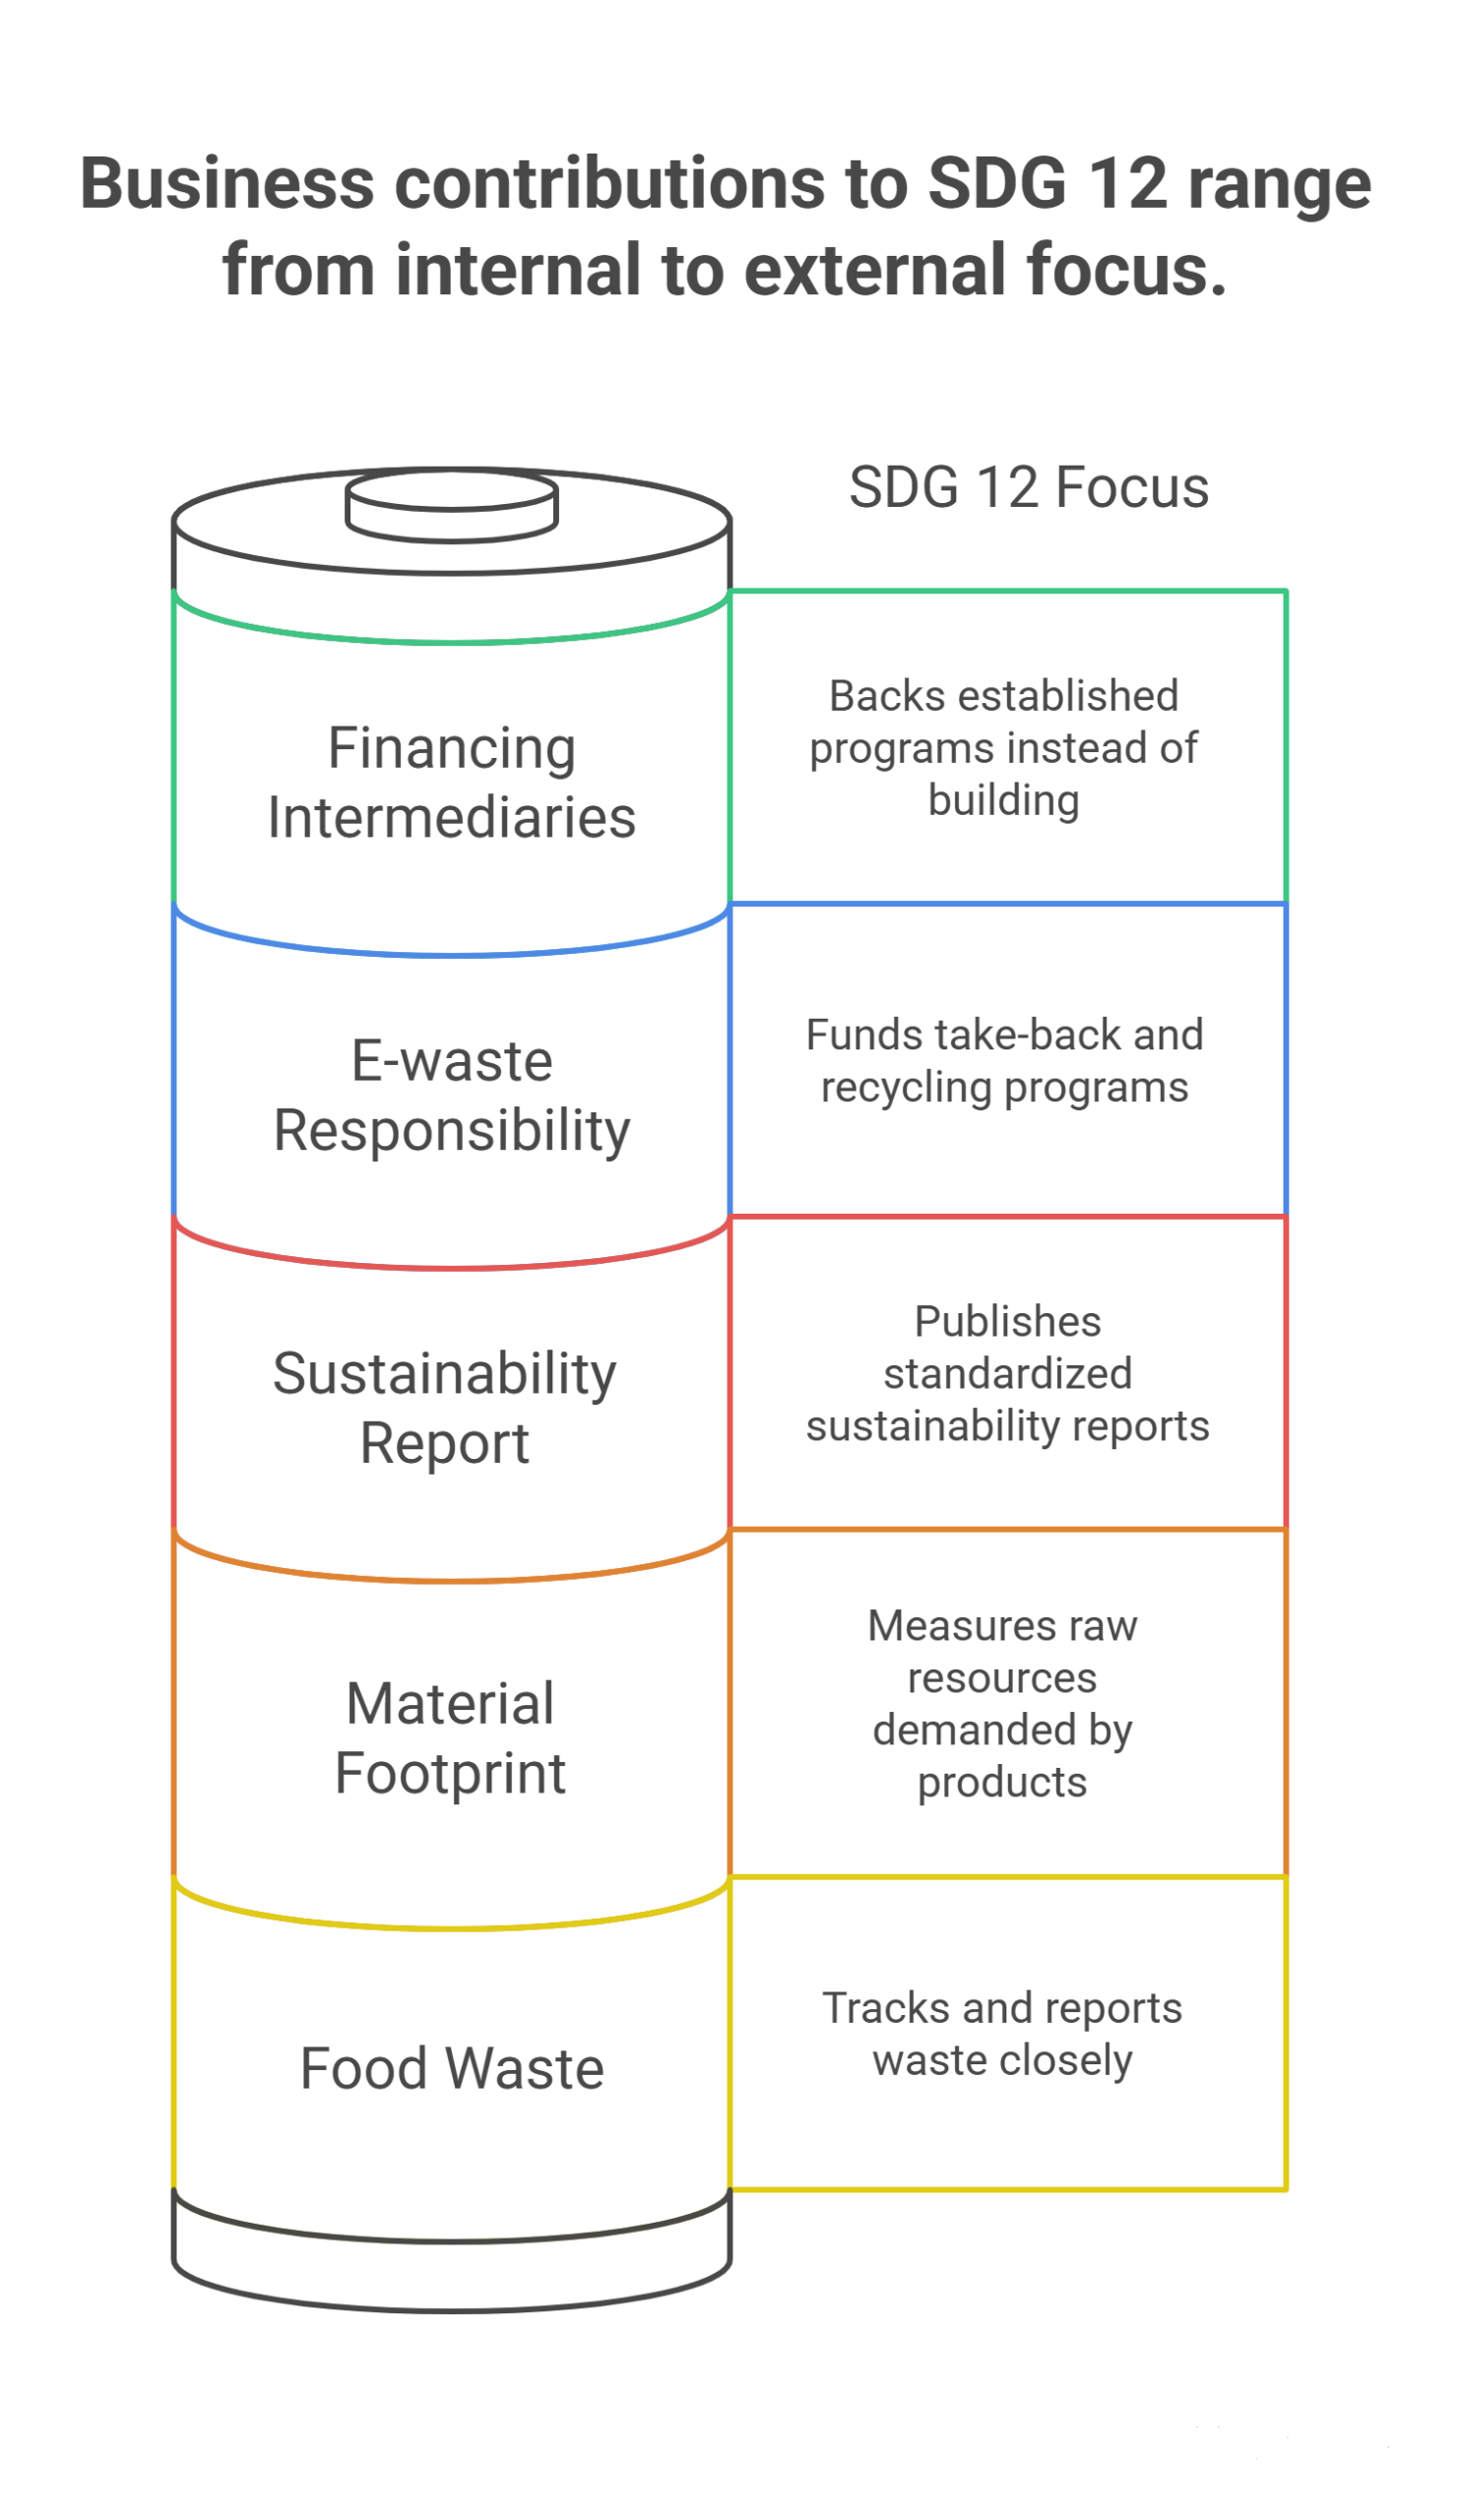
The same exercise applies here as it does for any SDG a company has no formal mandate on. Start with where operations touch consumption and waste, then look outward from there.
Publish a real sustainability report, not a marketing brochure
Target 12.6 already has strong momentum among large companies. Smaller companies can adopt the same standardized frameworks their larger peers use. That beats building an ad hoc version from scratch.
Measure material footprint, not just carbon footprint
Carbon tracking has become common. Material footprint is the raw resources a company’s products actually demand. It is tracked far less often than carbon. It is also the exact metric Target 12.2 is built around.
Take supply chain responsibility for e-waste past the point of sale
Companies selling electronics can fund formal take-back and recycling programs. That is a direct way to keep products out of informal sites like Agbogbloshie.
Cut food waste at the point it actually happens
Sixty percent of food waste happens at the household level. Retail and food service still account for a meaningful share. Businesses in food retail and hospitality can track and report waste closely. That is the approach behind Japan’s national program, which hit a 31% reduction.
Back financing intermediaries instead of building parallel infrastructure
UNEP’s One Planet network and the Global E-waste Monitor already exist as coordinated channels for this work. Adding capital or data to an established program usually reaches results faster. Building a standalone initiative from nothing rarely does.
Frequently Asked Questions
How many SDG 12 targets and indicators are there?
Eleven targets: eight outcome targets and three means-of-implementation targets. They are tracked through 13 indicators.
Is any country on track to meet SDG 12 by 2030?
No country is fully on track. Even top overall SDG performers face this problem. Finland, Sweden, and Denmark face real challenges specifically on this goal, due to high consumption levels.
Which countries perform best on SDG 12?
Estonia, Norway, and Iceland lead on circular economy performance and e-waste recycling rates. Japan has made fast, measurable progress cutting food waste.
Which countries struggle most with SDG 12?
Ghana, alongside China, India, and Nigeria, absorbs most of the world’s discarded electronics. Agbogbloshie in Accra is the world’s largest informal e-waste site, despite Ghana consuming far less than wealthier nations.
Why does India show such a low material footprint?
India’s 3.7 tonnes per capita reflects lower average consumption and living standards, not superior environmental policy. India is still the world’s second-largest extractor of raw materials in absolute terms.
Can a business without a formal sustainability mandate still contribute to SDG 12?
Yes. The clearest levers are publishing a real sustainability report and measuring material footprint alongside carbon footprint. Fund e-waste take-back programs too, and track food waste at the point it happens.
Conclusion
The number worth sitting with is not the 96% of large companies now publishing sustainability reports, encouraging as that is. It is the billion meals wasted every single day, a number that has barely moved in a decade.
Estonia and Norway show what genuine circular economy investment looks like, from deposit schemes to real recycling infrastructure. Australia and the United States show how policy leadership and a large footprint can coexist in the same country. Ghana shows what happens when the world’s waste lands somewhere other than where it was created.
None of that gets fixed by corporate reporting alone. Businesses have a narrower lever than governments and UN agencies, but a real one. That means measuring material footprint honestly and taking responsibility for products after the point of sale. It also means cutting waste where it actually happens.
All of that holds up better with financial models built to survive scrutiny. Building a financial model around a circular economy venture, a waste management program, or a sustainability-focused nonprofit? Oak’s nonprofit financial modeling services can help. Oak builds the numbers behind the mission.