Payback Period Formula A Guide to Smarter Investments
Payback Period Forumla: What You Need to Know?
Every business decision that involves spending money carries one fundamental question: when do we get that money back? The payback period formula gives you a concrete, no-nonsense answer. Whether you are evaluating a new software system, expanding office space, purchasing energy-efficient appliances, or weighing capital budgeting decisions between competing project proposals, this metric cuts through complexity and tells you exactly how long it takes to recover your initial investment.
This guide goes beyond the surface level. You will learn not just how to apply the payback period formula, but how to use it strategically alongside other financial analysis tools to make decisions that genuinely serve your business’s long-term return objectives.
What Is the Payback Period?
The payback period is the length of time it takes for the cumulative cash flow from an investment to equal the initial investment cost. In plain terms, it answers: “How long until this pays for itself?”
It is one of the most widely used tools in capital budgeting because it is intuitive, fast to calculate, and easy to communicate to stakeholders who may not have deep financial modeling backgrounds. Business owners, financial analysts, and project managers all rely on it as a first-pass filter when evaluating investment opportunities.
The shorter the payback period, the faster you recover your acquisition cost and the lower your exposure to risk. Longer payback periods suggest either lower annual cash flow or a larger initial investment, both of which increase uncertainty in the long run.
The Payback Period Formula
There are two versions of the payback period formula, depending on whether your annual cash inflows are consistent or variable.
1. Averaging Method (Uniform Cash Flows)
When cash flow per year is the same throughout the investment’s life, the averaging method applies:
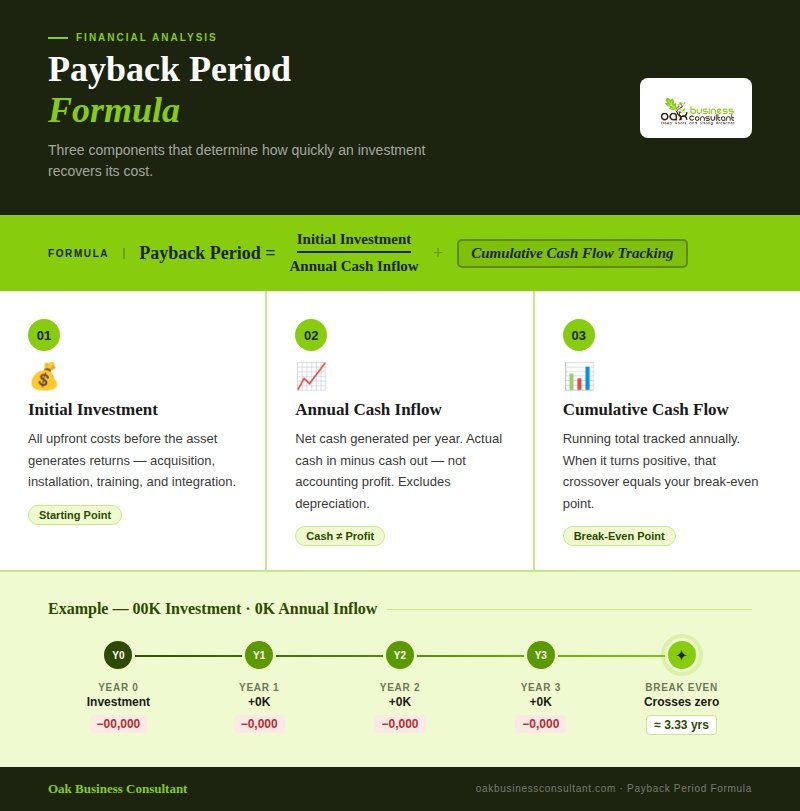
Payback Period = Initial Investment ÷ Annual Cash Inflow
Example: A company invests $120,000 in a new software system that generates $30,000 in cost savings annually.
Payback Period = $120,000 ÷ $30,000 = 4 years
This method is straightforward and ideal for investments like LED bulbs, double-glazed windows, or equipment with predictable output. The averaging method works best when cash flows are consistent and there are no significant seasonal swings.
2. Subtraction Method (Uneven Cash Flows)
When annual cash inflows vary from year to year, the subtraction method tracks cumulative cash flow year by year until the initial investment is fully recovered.
Example:
| Year | Annual Cash Flow | Cumulative Cash Flow |
| 0 | -$200,000 | -$200,000 |
| 1 | $50,000 | -$150,000 |
| 2 | $70,000 | -$80,000 |
| 3 | $60,000 | -$20,000 |
| 4 | $55,000 | +$35,000 |
The investment is fully recovered partway through Year 4.
To find the precise payback point within Year 4:
Remaining balance after Year 3: $20,000
Cash flow in Year 4: $55,000
Fraction of Year 4: $20,000 ÷ $55,000 = 0.36 years
Payback Period ≈ 3.36 years
The subtraction method is more realistic for most business investments, where cash inflows fluctuate based on market conditions, seasonal demand, or ramp-up periods.
Breaking Down the Formula: What Each Component Means
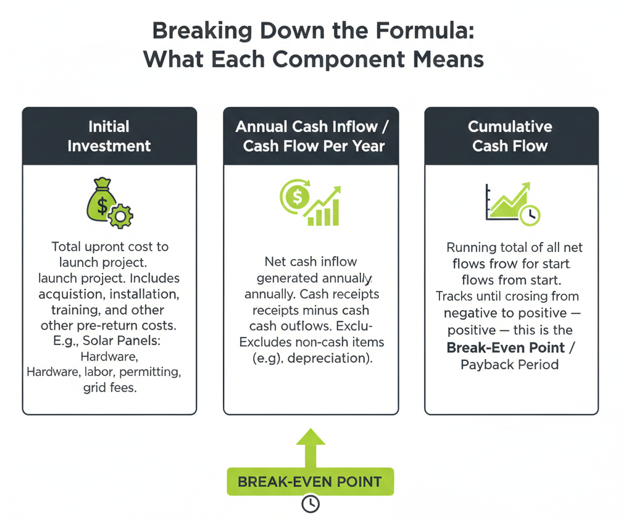
Initial Investment
The initial investment is the total upfront cost required to launch the project. This includes acquisition cost, installation, training, integration, and any other costs incurred before the asset begins generating returns. For example, if a business installs solar panels, the initial investment would include hardware, installation labor, permitting, and grid connection fees.
Annual Cash Inflow / Cash Flow Per Year
This is the net cash inflow the investment generates annually. It represents cash receipts minus cash outflows directly attributable to the investment. Do not confuse this with profit before tax, cash flow and accounting profit are different. Cash flow excludes non-cash items like depreciation and includes actual cash movements.
Cumulative Cash Flow
Cumulative cash flow is the running total of all net cash flows from the start of the investment. In the subtraction method, you track cumulative cash flow each year until it crosses from negative to positive, that crossing point is your break-even point, which corresponds directly to the payback period.
Payback Period Calculator: A Step-by-Step Process
If you prefer to use a payback period calculator or build one in Excel, here is the logical structure:
- Enter your initial investment (as a negative value in Year 0)
- Input projected annual cash inflows for each year
- Calculate cumulative cash flow by adding each year’s cash flow to the prior year’s cumulative total
- Identify the year in which cumulative cash flow first becomes positive
- Use the partial-year formula: subtract the negative balance from the prior year, divide by the current year’s cash inflow
- Add the result to the previous year number
This process can be easily built in Excel using basic formulas or modeled in more advanced financial modeling environments like Power BI for ongoing scenario analysis.
Payback Period vs. Discounted Payback Period
The standard payback period formula has one significant blind spot: it ignores the time value of money. A dollar received three years from now is worth less than a dollar received today, because money has earning potential over time.
The discounted payback period corrects for this by applying a discount rate to future cash flows before calculating the break-even point. Each year’s cash inflow is divided by (1 + discount rate)^n, where n is the number of years into the future.
Discounted Payback Period Example:
Using an 8% discount rate on a $100,000 investment:
| Year | Cash Flow | Discount Factor | Present Value | Cumulative PV |
| 1 | $30,000 | 0.926 | $27,778 | -$72,222 |
| 2 | $35,000 | 0.857 | $29,994 | -$42,228 |
| 3 | $35,000 | 0.794 | $27,772 | -$14,456 |
| 4 | $30,000 | 0.735 | $22,050 | +$7,594 |
The discounted payback period falls in Year 4, slightly later than the undiscounted calculation would suggest.
The discounted payback period is more conservative and more accurate when the interest rate environment is significant or the investment timeline is long. It bridges the gap between the simple payback metric and more comprehensive tools like net present value.
Payback Period vs. Net Present Value (NPV)
The net present value method and payback period serve different purposes in the capital budgeting toolkit.
Net present value calculates the total value of all discounted cash flows over the life of the investment, minus the initial investment. A positive NPV means the investment creates value beyond the discount rate hurdle. A negative NPV means it destroys value.
The payback period, by contrast, tells you nothing about total profitability, only about how quickly you recover your initial cost. An investment could have a short payback period but a terrible NPV if cash flows drop sharply after the payback date. Conversely, a project with a long payback period might generate exceptional returns over a 20-year horizon.
Best practice in corporate finance is to use both: the payback period as a liquidity and risk screen, and net present value (along with the internal rate of return) as the primary valuation tools. Together, they give you a complete picture of both speed of cost recovery and total financial value created.
When Should Business Owners Use the Payback Period Formula?
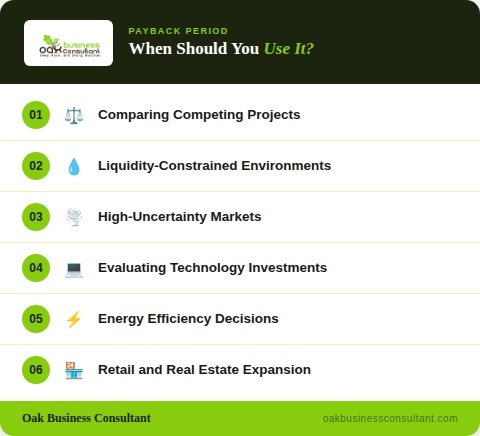
The payback period formula is most useful in the following contexts:
Comparing competing projects: When two investment opportunities have similar NPVs, the one with the shorter payback period carries less risk. Project selection committees often use payback as a tiebreaker.
Liquidity-constrained environments: When cash flow management is critical and a business cannot afford to have capital tied up for long periods, the payback period ensures investments contribute to liquidity within a defined timeframe.
High-uncertainty markets: In volatile industries, the faster an investment pays back, the lower the exposure to unpredictable adverse events. Risk mitigation is a core function of payback analysis.
Evaluating technology investments: Whether it is a new software system, automation equipment, or a digital platform, businesses regularly use payback calculations to justify the acquisition cost to stakeholders.
Energy efficiency decisions: Businesses evaluating solar panels, double-glazed windows, traditional washer and dryer replacements, or other energy-efficient appliances routinely apply the payback period to determine whether upfront costs are worth the long-term cost savings.
Retail and real estate expansion: Opening new store locations, leasing office space, or entering new markets all involve significant initial investment. Payback analysis helps determine viability before committing capital.
CAC Payback Period: A Critical SaaS and Growth Metric
Beyond traditional capital budgeting, the CAC payback period has become a cornerstone metric in subscription-based and SaaS businesses. It measures how many months it takes to recover the customer acquisition cost (CAC) from a new customer.
CAC Payback Period Formula:
CAC Payback Period = Customer Acquisition Cost ÷ (Monthly Recurring Revenue × Gross Margin %)
For example, if a SaaS company spends $1,200 to acquire a customer (including all sales and marketing expense), and that customer generates $100 per month at a 70% gross margin:
CAC Payback Period = $1,200 ÷ ($100 × 0.70) = $1,200 ÷ $70 = 17.1 months
The dollar-based CAC payback period refines this further by incorporating expansion MRR and churned MRR, giving a more dynamic view of how quickly a customer cohort pays back acquisition costs net of churn and upsells.
A strong LTV/CAC ratio combined with a short CAC payback period signals a healthy growth strategy and efficient GTM efficiency, a key part of any SaaS metrics framework. Investors and financial analysts scrutinize these numbers closely when evaluating scaling potential and capital efficiency.
Limitations of the Payback Period Formula
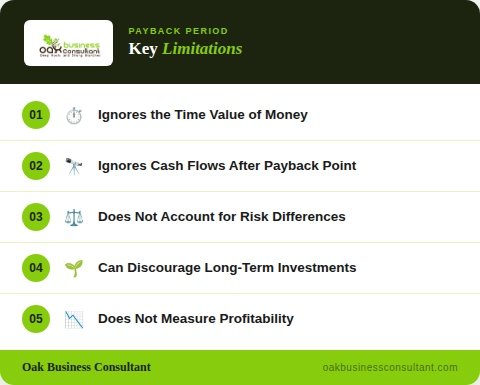
No single financial metric tells the whole story. The payback period formula has real limitations that financial teams and business owners must acknowledge:
Ignores the time value of money: Unless you use the discounted payback period, the formula treats a dollar received in Year 5 the same as one received in Year 1. This overstates the value of future cash flows.
Ignores cash flows after the payback point: The formula only cares about cost recovery. An investment with a 3-year payback that generates enormous cash inflows in Years 4–15 looks identical to one that generates nothing after Year 3.
Does not account for risk differences: Two projects can have the same payback period while having very different risk profiles. The payback period alone cannot differentiate between them.
Can discourage long-term investments: Businesses that rely too heavily on payback period benchmarks may systematically underinvest in high-value, long-horizon projects. This can impair growth strategy over time.
Does not measure profitability: A short payback period does not guarantee a profitable investment. Always pair payback analysis with NPV, internal rate of return, or discounted cash flow analysis.
What Is a Good Payback Period?
There is no universal benchmark for what constitutes a “normal” payback period. It depends heavily on industry, asset type, and risk tolerance.
General benchmarks in practice:
- Manufacturing equipment: 3–7 years is typical
- Technology/software systems: 2–4 years is common
- Energy efficiency upgrades (solar panels, LED bulbs): 5–10 years depending on energy costs
- SaaS customer acquisition: Under 18 months is considered healthy; under 12 months is strong
- Real estate / store locations: Often 7–15 years
In private equity investing, many firms apply payback thresholds as part of their investment criteria. The exact target varies by fund strategy, but faster is almost always preferred, all else being equal.
The right benchmark for your business depends on your cost of capital, competitive landscape, and strategic priorities.
Practical Example: Solar Panel Investment
A small business is considering installing solar panels on its warehouse. The installation cost is $80,000. The business currently spends $18,000 per year with its power provider on electricity. After installation, estimated electricity costs drop to $3,000 per year, yielding annual cost savings of $15,000.
Using the averaging method:
Payback Period = $80,000 ÷ $15,000 = 5.33 years
If the solar panels have a 25-year lifespan, the long-term return is substantial, roughly $375,000 in cost savings over the panel’s life, for an $80,000 upfront investment. The payback period confirms reasonable cost recovery, and NPV analysis would confirm the investment’s value.
Frequently Asked Questions
How do you calculate the payback period?
For uniform cash flows, divide the initial investment by the annual cash inflow (averaging method). For uneven cash flows, track cumulative cash flow year by year using the subtraction method. When the cumulative total turns positive, you have found your payback period — add a partial-year calculation for precision. For example: $200,000 initial investment with $50,000 annual cash flow = 4-year payback.
Which is better: NPV or payback period?
Net present value is the superior tool for measuring true financial value, because it accounts for the time value of money and captures all cash flows over the investment’s full life. The payback period is better for assessing liquidity risk and speed of cost recovery. Most financial analysts use both — NPV as the primary decision metric, payback period as a risk and liquidity filter.
How do you calculate ROI and payback period?
Return on investment (ROI) = (Net Profit ÷ Initial Investment) × 100. The payback period = Initial Investment ÷ Annual Cash Inflow (for uniform flows). Both metrics are distinct: ROI tells you how profitable an investment is relative to its cost, while the payback period tells you how quickly you recover that cost. A complete financial analysis includes both, along with NPV and internal rate of return.
What is a normal payback period?
It varies by industry and asset type. Technology and software investments often target 2–4 years. Manufacturing equipment typically falls in the 3–7 year range. Energy efficiency upgrades like solar panels or double-glazed windows often have 5–10 year payback periods. For SaaS businesses, a CAC payback period under 18 months is considered healthy. There is no single “normal” — the right target depends on your discount rate, risk tolerance, and strategic time horizon.
Conclusion
The payback period formula is one of the most practical tools in capital budgeting and financial analysis. Used properly, it helps business owners prioritize investments, manage cash flow risk, and communicate financial decisions clearly to stakeholders. Whether you are evaluating solar panels, a new software system, store expansion, or customer acquisition cost in a SaaS growth model, payback analysis gives you an immediate, concrete answer to the question that matters most in early-stage investment decisions: how quickly does this pay for itself?
But the payback period is most powerful when it is part of a broader financial framework — paired with net present value, discounted cash flow analysis, and internal rate of return to build a complete picture of investment value.
If your business is making significant capital allocation decisions and you want expert-level financial strategy behind them, Oak Business Consultant’s CFO services can help. From financial modeling and break-even analysis to full capital budgeting support, our fractional CFO team brings the rigor and clarity your investment decisions deserve. Contact Us to Discuss Your Capital Allocation and CFO Needs.