Oil and Gas Industry Financial Ratios and Future
Oil and gas financial ratios: the metrics that actually separate strong operators from weak ones
A standard financial ratio playbook does not translate cleanly to oil and gas. A company can post a healthy net profit margin one year and swing to a loss the next, without changing anything about how it runs its operations, simply because benchmark prices moved. Debt loads that look aggressive in most industries are routine here, because exploration and production require capital most companies cannot generate from cash flow alone. Reserve accounting adds a layer that most financial statements never touch.
This guide breaks down the ratios and KPIs that actually explain performance in this sector, organized the way an analyst or lender would use them: by segment, by what they reveal, and by where they tend to mislead if read in isolation.
Why oil and gas needs its own financial playbook
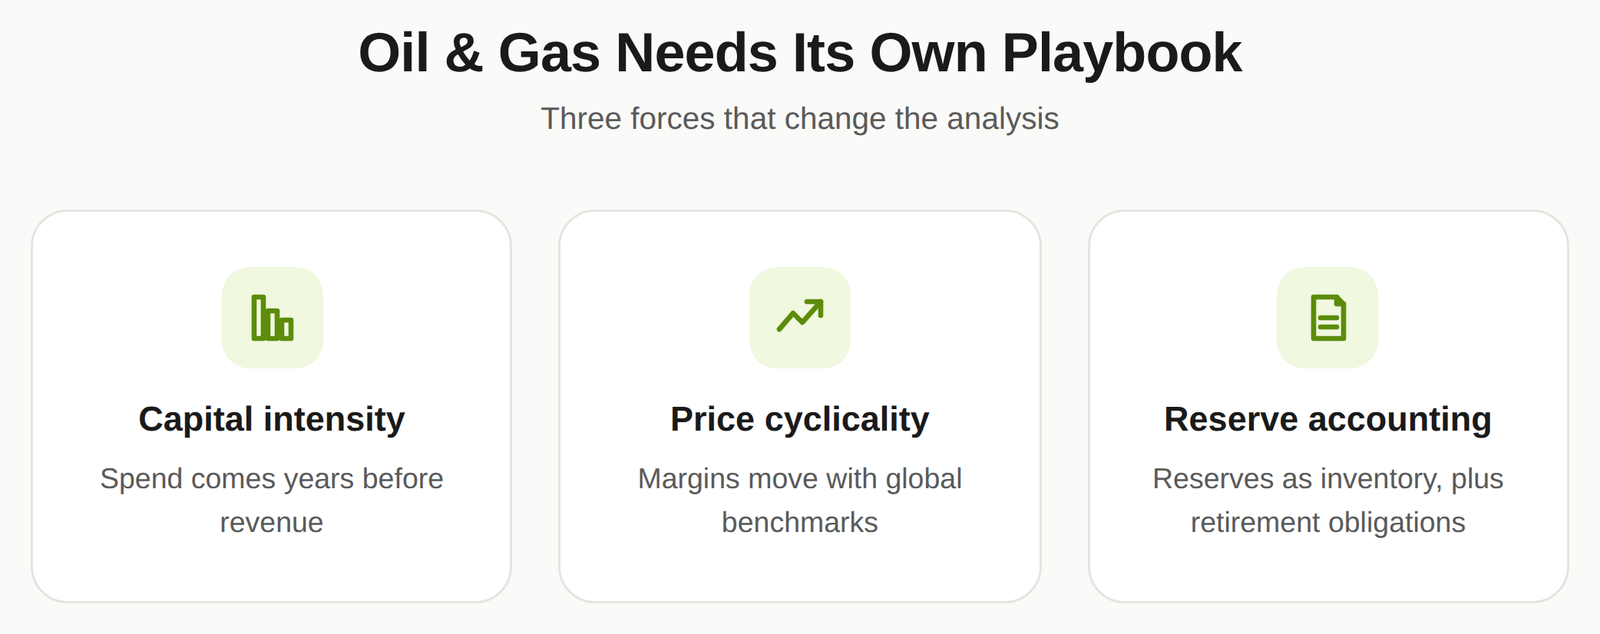
Three features of this industry force a different approach to analysis.
Capital intensity. Exploration, drilling, and production facilities require heavy upfront investment long before any revenue arrives. A company can have strong reserves and still show weak near-term returns because the capital is still being deployed.
Price cyclicality. Revenue depends on benchmark prices the company does not control. West Texas Intermediate, Brent, and Henry Hub prices swing with OPEC decisions, geopolitical events, and global demand shifts, and margins move with them regardless of operational execution.
Reserve-based accounting. Oil and gas reserves are often treated as inventory, and companies carry asset retirement obligations, legal liabilities tied to eventually decommissioning wells and facilities. Both add complexity that does not show up in a typical financial analysis of a non-extractive business.
The three segments, and why the ratios shift by segment
Oil and gas companies fall into three operating segments, and the ratios that matter shift depending on which one a company sits in.
| Segment | What it does | Ratios that matter most |
| Upstream (E&P) | Exploration, drilling, and production of crude oil and natural gas | Reserve replacement ratio, F&D costs, EBITDAX, lifting cost per barrel |
| Midstream | Transportation, storage, and processing between production and market | Throughput volume, contract coverage ratio, distributable cash flow |
| Downstream | Refining, marketing, and distribution to end users | Refining margin (crack spread), inventory turnover, capacity utilization |
Integrated majors operate across all three, which is why a single ratio in isolation, like net profit margin, can hide very different underlying dynamics depending on segment mix.
Profitability ratios that matter most
| Ratio | Formula | What it tells you |
| Net profit margin | Net income / Total revenue | Share of revenue converted to bottom-line profit after all costs |
| Operating margin | Operating income / Revenue | Profitability from core operations before financing and tax effects |
| EBITDA | Net income + interest + taxes + depreciation + amortization | Operating profitability stripped of financing and accounting choices |
| EBITDAX | EBITDA + exploration expenses | An E&P-specific version of EBITDA that normalizes volatile exploration costs across companies and periods |
| Return on equity (ROE) | Net income / Shareholder equity | How effectively a company turns shareholder capital into profit |
| Return on invested capital (ROIC) | Net operating profit after taxes / Total invested capital | Efficiency of capital allocation across both debt and equity financing |
| Total shareholder return (TSR) | (Ending price − Beginning price + Dividends) / Beginning price | Total return delivered to shareholders, combining price appreciation and dividends |
EBITDAX deserves particular attention because it is not a generic metric borrowed from other industries. Exploration and production companies expense dry-hole costs differently depending on accounting method, which distorts EBITDA comparisons across companies. EBITDAX adds exploration expense back specifically to correct for that.
Leverage and solvency: reading debt the right way
Oil and gas companies typically run higher leverage than most industries because production assets are expensive and long-lived, and lenders are willing to finance against proved reserves. That means the standard advice to favor low debt does not apply cleanly here. What matters is whether leverage is sized to cash flow and hedged against price risk.
| Ratio | Formula | Why it matters here |
| Debt-to-equity | Total liabilities / Shareholder equity | Baseline leverage measure, though “moderate” looks different by sub-sector |
| Debt-to-capital | Total debt / (Total debt + Total equity) | Shows what share of the capital base is financed by debt versus equity |
| Debt/EBITDA | Total debt / EBITDA | Estimates how many years of earnings would be needed to clear debt, a common covenant metric in this sector |
A company can carry a debt-to-equity ratio that would concern a lender in most industries and still be considered well-capitalized in oil and gas, provided its debt/EBITDA sits within a manageable range and its production is at least partially hedged.
Liquidity and cash generation
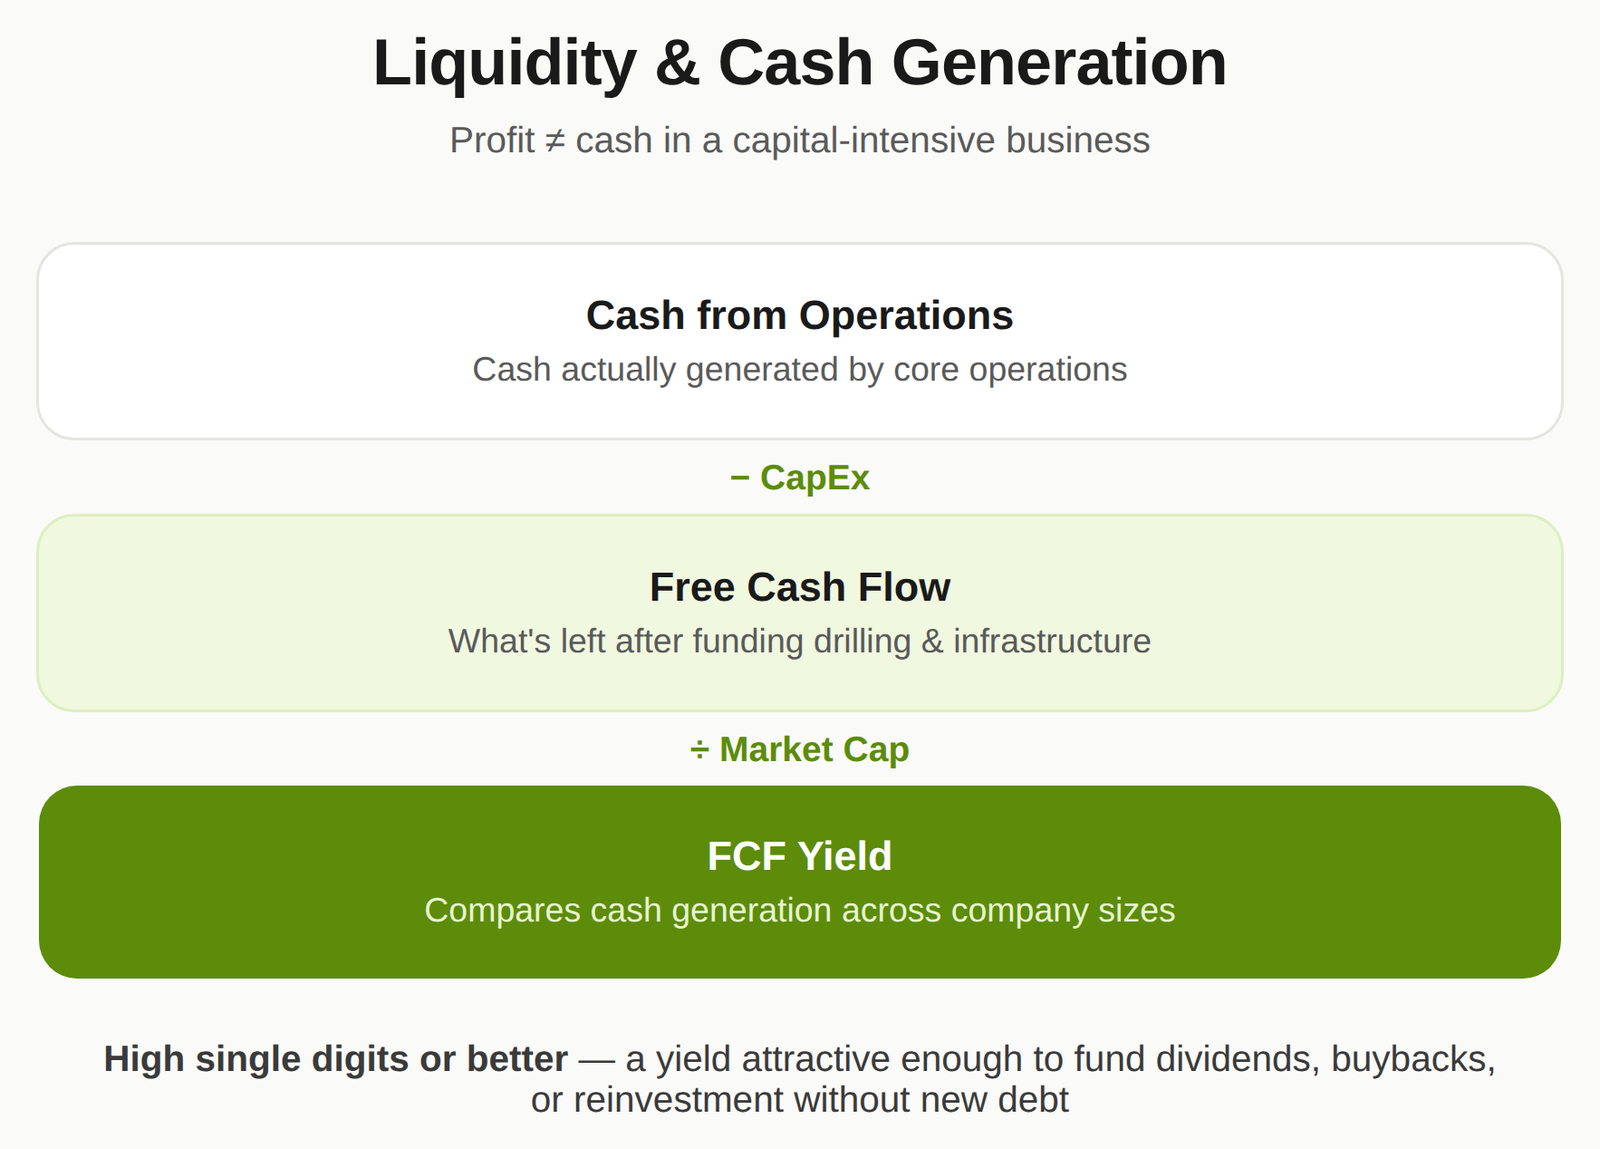
Profit on the income statement and cash in the bank are not the same thing in a capital-intensive business, which is why cash flow analysis carries extra weight in this sector.
Cash flow from operations (CFO) measures cash actually generated by core operations, adjusted for non-cash items and working capital changes. A company can report positive net income while CFO tells a different story if receivables or inventory are ballooning.
Free cash flow (FCF) is CFO minus capital expenditures, and it is arguably the single most important number for evaluating an oil and gas company, since it shows what is left over after the company has funded the drilling and infrastructure spending needed to sustain production.
FCF yield, free cash flow divided by market capitalization, lets investors compare cash generation across companies of different sizes. A yield in the high single digits or better is generally considered attractive in this sector, since it signals the business can fund dividends, buybacks, or reinvestment without relying on new debt.
Valuation ratios investors watch
| Ratio | Formula | What a high or low reading suggests |
| Price-to-book (P/B) | Market price per share / Book value per share | Below 1 can flag an undervalued stock or reflect market skepticism about asset values |
| Price-to-earnings (P/E) | Market price per share / Earnings per share | High P/E suggests expected earnings growth or overvaluation; low P/E often reflects cyclical earnings that the market discounts |
P/E ratios in oil and gas swing more than in most sectors precisely because earnings are cyclical. A low P/E during a commodity price trough is not automatically a bargain, and a high P/E during a price spike is not automatically a warning sign. Both need to be read against where prices sit in the cycle.
Operational KPIs unique to this industry
These metrics do not appear in a generic financial metrics and KPI dashboard built for other industries, but they are essential for evaluating an E&P company specifically.
| Metric | Formula | What it measures |
| Daily production volume | Total production / Number of days | Operational scale and output trend |
| Reserve life index (RLI) | Proved reserves / Annual production | Years of production left at current rates |
| Reserve replacement ratio (RRR) | New reserves added / Production | Whether a company is replacing what it produces; above 100% signals growing reserves |
| Organic reserve replacement | Reserve increase from E&D (excluding acquisitions) / Production | Whether reserve growth comes from a company’s own exploration work, not purchased assets |
| Finding and development (F&D) costs | (Exploration + development costs) / Change in proved reserves | Cost efficiency of adding new reserves |
| Lifting cost per BOE | Total lifting cost / Total production in barrels of oil equivalent | Direct cost efficiency of extraction |
| Cash cost per barrel | Total cash production cost / Total barrels produced | Direct production cost, excluding depreciation and taxes |
| Production efficiency ratio (PER) | Actual production / Potential production | How close a company runs to its maximum output capacity |
| Capital expenditure (CapEx) | Reported under investing activities in the cash flow statement | Investment in sustaining and growing production capacity |
A reserve replacement ratio above 100% paired with rising F&D costs is worth flagging specifically. It can mean a company is replacing reserves in harder-to-reach or more expensive locations, which is not visible from the RRR figure alone.
Industry benchmarks, as of 2026
Benchmarks shift with the commodity cycle, so treat these as a snapshot rather than a fixed target. As of Q1 2026, the oil and gas production industry posted a trailing-twelve-month net margin near 12.5%, an operating margin near 27.5%, and an EBITDA margin above 32%, according to CSIMarket data. Industry-wide revenue for oil drilling and gas extraction in the United States reached an estimated $576.9 billion in 2026, a figure IBISWorld attributes largely to firmer oil and gas pricing during the year.
The practical takeaway: compare a company’s ratios against sub-sector peers and against where prices sit in the current cycle, not against a fixed historical average. A margin that looks weak against a price-spike year can be perfectly healthy against a price trough.
Risk management: hedging and the energy transition
Two risk factors sit outside the ratios above but shape how those ratios should be interpreted.
Hedging. Companies use futures contracts and options to lock in prices for a portion of future production. A well-hedged company sacrifices some upside during a price spike in exchange for a more stable cash flow baseline, which supports steadier CapEx and dividend planning. When comparing two companies with similar ratios, checking hedging policy often explains why one has more predictable cash flow than the other.
Energy transition and ESG. Stricter emissions regulation, carbon pricing mechanisms, and shifting capital allocation toward renewables are reshaping how investors weigh long-term risk in this sector. Companies that are visibly diversifying into lower-carbon energy or investing in emissions reduction tend to command a different risk premium than those that are not, independent of their current-period ratios.
Common challenges and how companies respond
| Challenge | Typical response |
| Commodity price volatility | Hedging through futures and options contracts |
| High exploration and production costs | Cost discipline, phased capital spending, technology adoption |
| Regulatory and environmental risk | Compliance investment, proactive stakeholder engagement |
| Long-term capital requirements | Joint ventures, partnerships, selective asset divestitures |
| Energy transition pressure | Portfolio diversification into renewables, R&D in lower-carbon technology |
Frequently Asked Questions
Why is EBITDA not enough for evaluating an E&P company?
Standard EBITDA does not adjust for exploration expense, which varies significantly across companies depending on accounting method and drilling activity. EBITDAX corrects for that, which makes it the more reliable comparison metric within upstream oil and gas.
Is high debt always a red flag in oil and gas?
Not necessarily. This industry typically runs higher leverage than most because production assets are capital-intensive and reserves can be financed against. What matters more is debt relative to EBITDA and whether production is hedged against price swings.
How does the reserve replacement ratio affect long-term valuation?
An RRR consistently above 100% signals a company is growing its resource base faster than it depletes it, which supports future production and, by extension, future cash flow. A ratio persistently below 100% raises questions about how long current production levels can be sustained.
Why do P/E ratios vary so much across oil and gas companies?
Earnings in this sector are highly cyclical, tied to benchmark oil and gas prices that companies do not control. A P/E ratio needs to be read against where the current price cycle sits, not compared directly to P/E ratios in less cyclical industries.
How does the shift toward renewable energy affect financial analysis of oil and gas companies?
It adds a forward-looking risk factor that traditional ratios do not capture. Analysts increasingly weigh a company’s diversification efforts and ESG positioning alongside standard financial reporting metrics when assessing long-term resilience.
Conclusion
Financial ratios in oil and gas only tell the full story when read together and against the right benchmark. A strong EBITDAX means less if F&D costs are climbing. A high FCF yield means less if reserve replacement is falling behind production. The metrics in this guide are built to be read as a set, not picked one at a time.
If you are building out a full financial model for an oil and gas venture, whether for internal planning, investor documents, or a valuation, Oak Business Consultant’s oil and gas financial modeling service is built specifically around these industry dynamics: reserve-based forecasting, segment-level assumptions, and hedging scenarios included. You can also explore our broader KPI and metrics resources for other capital-intensive sectors.
Contact Oak Business Consultant to talk through what a tailored financial model or analysis would look like for your oil and gas business.