All You Need To Know About Marginal Cost
Marginal cost explained: the formula, the curve, and when to stop producing
Every business eventually asks the same question: should we make one more unit? Marginal cost is the number that answers it. Get it wrong in your financial model and you will either turn away profitable orders or keep producing units that quietly lose you money.
What is marginal cost?
Marginal cost is the additional cost of producing one more unit of a good or service. If making 100 units costs $8,000 and making 101 units costs $8,050, the marginal cost of that 101st unit is $50.
It is easy to confuse marginal cost with variable cost, but they are not the same thing. Variable costs, like raw materials and hourly labor, move directly with output. Marginal cost captures the full change in total cost, which means it also picks up any new fixed costs that kick in, such as leasing extra warehouse space or buying a second machine once the current one hits capacity. That distinction matters more than most people expect, especially once production scales beyond a company’s existing setup.
The marginal cost formula
The formula itself is short:
Marginal Cost = Change in Total Cost ÷ Change in Quantity
Both halves of that formula deserve a closer look before you plug numbers in.
Change in total cost is the difference between your total production cost at the new output level and your total production cost at the old one. It includes both variable costs (materials, direct labor, utilities tied to output) and any step change in fixed costs (new equipment, added shifts, extra facility space).
Change in quantity is simply the difference in units produced between the two periods you are comparing.
Divide the first by the second, and the result is the cost of the next unit, not the average cost of all units combined. That last point trips up more financial models than any other part of this calculation.
How to calculate marginal cost: a worked example
Consider a small furniture workshop scaling production over a year. The table below shows total cost at five different output levels and the marginal cost of getting from one level to the next.
| Units produced | Total cost | Marginal cost per unit |
| 100 | $8,000 | n/a |
| 150 | $10,500 | $50 |
| 200 | $12,600 | $42 |
| 250 | $15,750 | $63 |
| 300 | $21,000 | $105 |
Between 100 and 200 units, marginal cost falls. The workshop is spreading fixed costs like rent and equipment over more output, and it is buying materials in larger, cheaper batches. Past 200 units, marginal cost climbs. The team is now paying overtime rates, squeezing more shifts out of the same machines, and eventually needs a second workspace. That rise and fall is not a modeling error. It is the normal shape of a marginal cost curve, and it is the reason a business cannot assume unit economics stay flat as volume grows.
Marginal cost vs. average cost
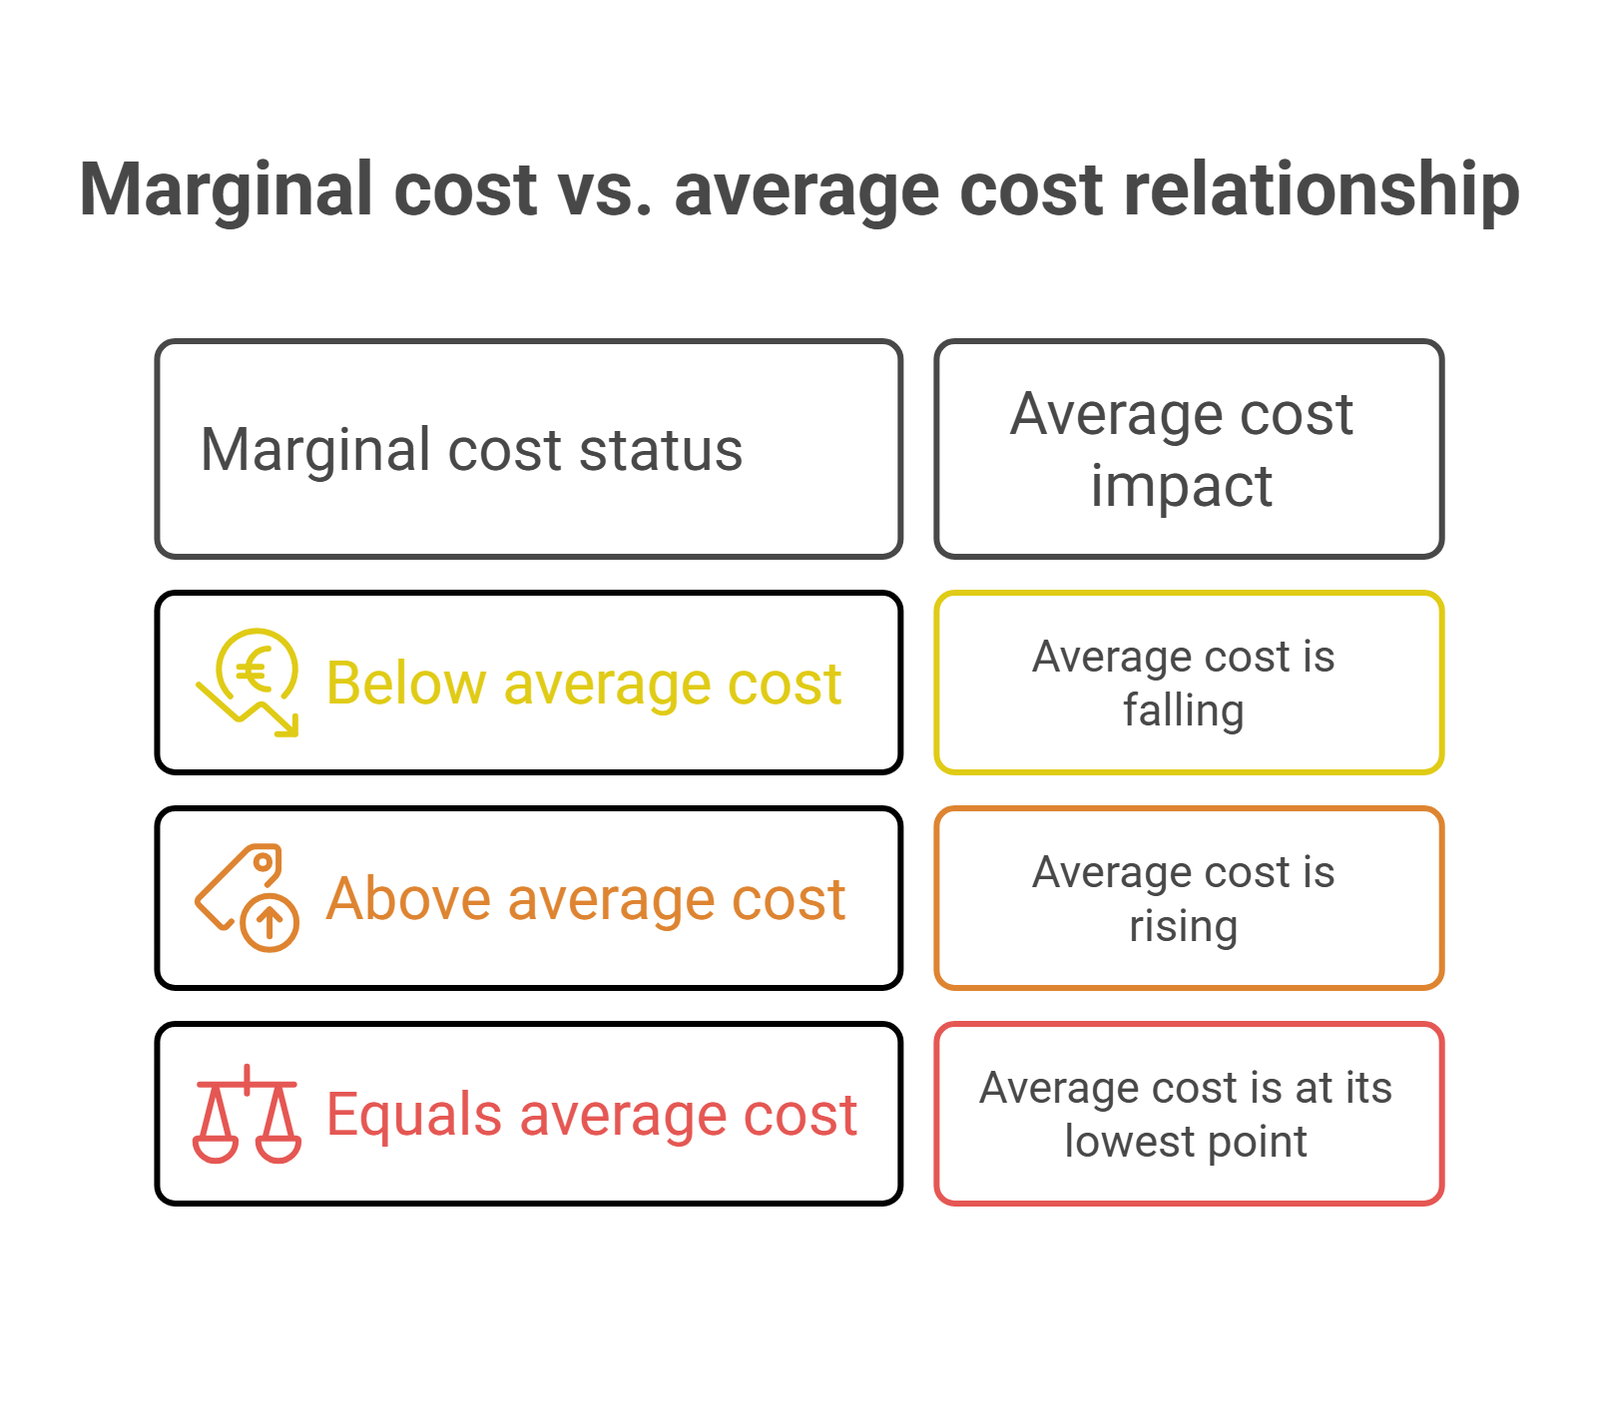
Average cost is total cost divided by total units, which tells you what each unit has cost you so far. Marginal cost tells you what the next unit will cost. The two move together in a predictable pattern:
- When marginal cost is below average cost, average cost is falling. Each new unit is cheaper than the ones before it, pulling the average down.
- When marginal cost is above average cost, average cost is rising. Each new unit is more expensive than the ones before it, pulling the average up.
- When marginal cost equals average cost, average cost is at its lowest point.
Plotted on a chart, this produces the U-shaped marginal cost curve that shows up in every microeconomics textbook, and it explains why a product can look profitable on an average-cost basis while individual additional units are quietly losing money. A financial model that only tracks average cost per unit will miss this entirely.
Why marginal cost drives pricing and production decisions
Marginal cost is most useful when compared against marginal revenue, meaning the extra revenue earned from selling one more unit.
- If marginal revenue is greater than marginal cost, producing (and selling) the next unit adds to profit.
- If marginal revenue is less than marginal cost, that next unit costs more than it earns, and producing it destroys profit even if the business is still profitable overall.
- The point where marginal cost equals marginal revenue is, in theory, the output level that maximizes profit.
This is also where marginal cost pricing comes in. When a business has spare capacity, such as an airline with unsold seats or a factory running below full output, it can sometimes accept an order priced closer to marginal cost than to its normal selling price. The order still covers its own added cost and contributes something to fixed costs already being paid regardless. It is a short-term, situational tactic rather than a standard pricing policy, and it only makes sense when there is genuine idle capacity to fill.
Marginal cost, economies of scale, and diseconomies of scale
Businesses chase economies of scale because it means each additional unit gets cheaper to produce, exactly what happened in the furniture workshop example between 100 and 200 units. Bulk purchasing, better-utilized equipment, and spreading fixed costs over more output all push marginal cost down.
Diseconomies of scale work in reverse. Past a certain point, a business runs out of easy efficiency gains. Overtime pay, aging equipment under heavier use, coordination costs across a larger workforce, and the need for entirely new facilities all push marginal cost back up, as shown in the workshop’s climb from 200 to 300 units. Every business has a ceiling where growth stops getting cheaper and starts getting more expensive, and finding that ceiling before you hit it is part of what a well-built financial model is for.
Marginal cost in your financial model
Inside a financial model in Excel, marginal cost analysis feeds directly into production and pricing assumptions rather than sitting as a standalone calculation. A model built for financial modeling purposes typically separates fixed and variable cost drivers by line item, so that when you flex the units-produced assumption, the model recalculates marginal cost at each output level instead of applying one blended rate across the board.
This is also where marginal cost connects directly to break-even analysis: knowing your marginal cost at different volumes tells you not just when you cover costs, but which volume level actually maximizes your margin, rather than just clearing zero.
Common mistakes when calculating marginal cost
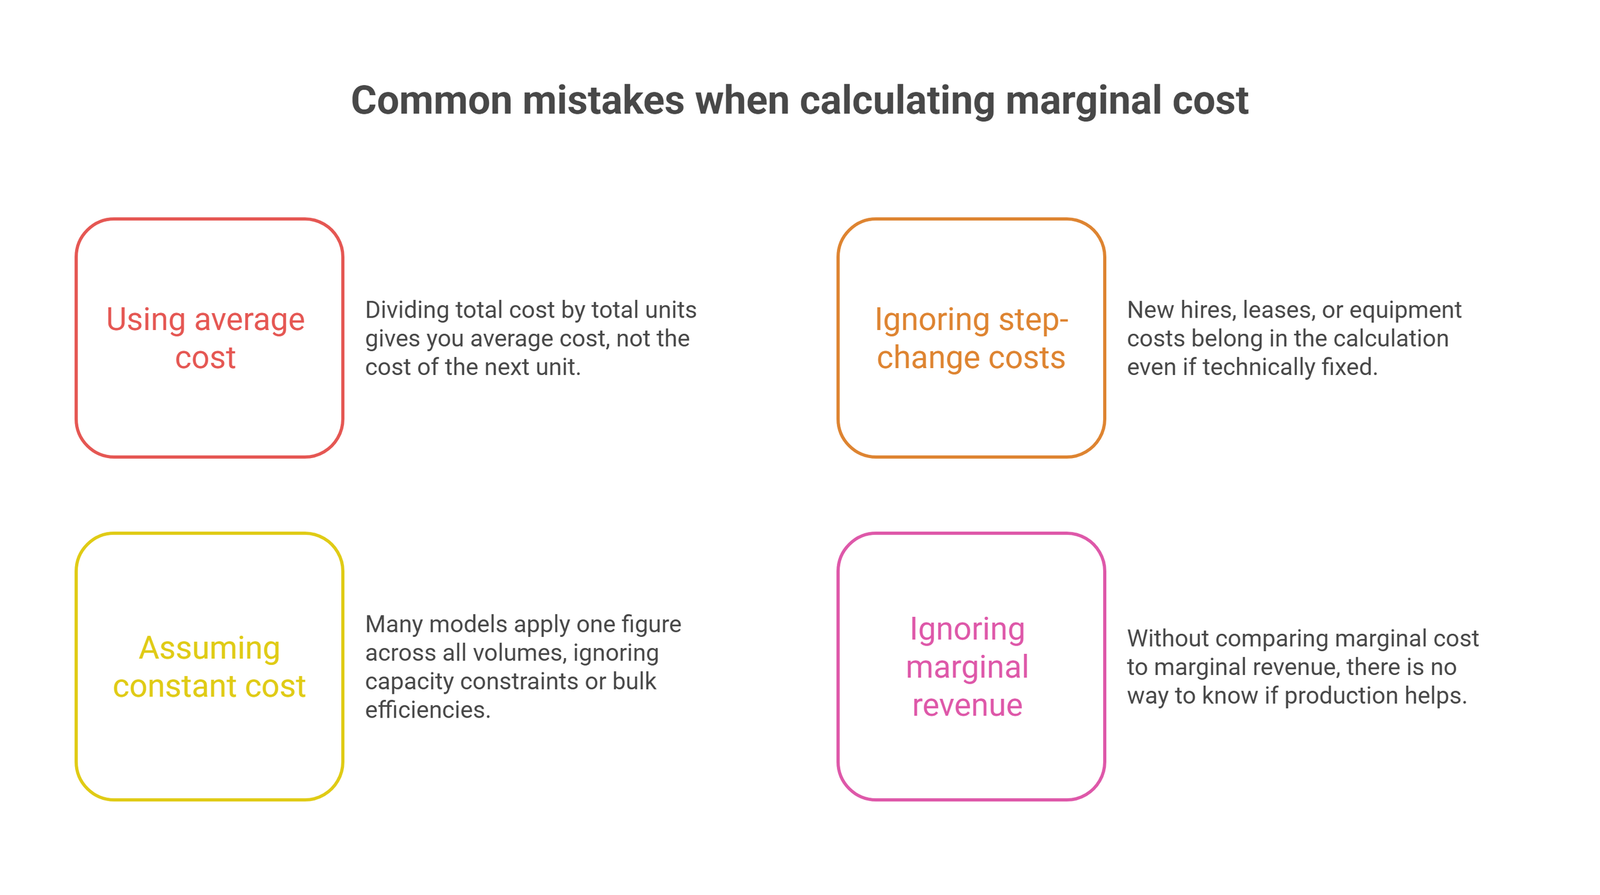
A few errors show up repeatedly in financial models and budgeting exercises:
- Using average cost instead of marginal cost. Dividing total cost by total units gives you average cost, not the cost of the next unit. These only match at one specific output level.
- Leaving out step-change fixed costs. If producing more units requires a new hire, a new lease, or new equipment, that cost belongs in the calculation even though it is technically a fixed cost, not a variable one.
- Assuming marginal cost is constant. Many simple models apply one marginal cost figure across all volumes. In reality, it moves as the business hits capacity constraints or unlocks bulk-purchasing efficiencies, as the earlier table shows.
- Ignoring marginal revenue entirely. Marginal cost on its own only tells half the story. Without comparing it to marginal revenue, there is no way to know whether producing more actually helps.
Frequently Asked Questions
Is marginal cost the same as variable cost?
No. Variable cost is one input into marginal cost. Marginal cost also captures any new fixed costs triggered by producing beyond current capacity, such as additional equipment or space.
What is the difference between marginal cost and marginal revenue?
Marginal cost is what it costs to produce one more unit. Marginal revenue is what you earn from selling one more unit. Comparing the two tells you whether producing that unit is worth it.
Can marginal cost be negative?
In standard cost accounting, no. Total cost should not fall as output rises. A negative result usually signals a data or calculation error, such as comparing mismatched periods.
What does it mean when marginal cost equals average cost?
It means average cost is at its lowest point. Below that output level, marginal cost pulls the average down; above it, marginal cost pulls the average up.
Why would a business price below its normal rate using marginal cost pricing?
To fill spare capacity with orders that still cover their own cost and contribute something toward fixed costs already being paid, rather than leaving that capacity unused.
How does marginal cost show up in an Excel financial model?
It is typically built from separated fixed and variable cost drivers, so the model recalculates the cost of the next unit at each output level instead of using one flat rate for every volume.
What causes marginal cost to rise as production increases?
Usually a capacity constraint: overtime pay, machinery running past its efficient range, or the need for new equipment or facilities to keep scaling.
The bottom line on marginal cost
Marginal cost is a small formula that answers a big question: whether the next unit is worth making. Treating it as a fixed number, or confusing it with average cost, is one of the more common ways a financial model misleads the people relying on it. Building marginal cost properly into your forecasting means knowing not just your current unit economics, but where they start working against you.
If you are building out a financial model and want marginal cost, break-even points, and pricing assumptions modeled correctly from the start, Oak’s fractional CFO services team can help you get the numbers right before they shape a pricing or production decision.