An Excel KPI (Key Performance Indicator) Dashboard is a powerful tool designed to compile and display critical metrics that measure the performance of a business or project. Crafted within the versatile environment of Microsoft Excel, this dashboard allows managers, analysts, and stakeholders to visualize key data points at a glance, enabling informed decision-making and strategic planning. The dashboard’s primary function is to aggregate data from various sources into a cohesive, easy-to-understand format, highlighting trends, progress towards goals, and areas needing attention.
The Excel KPI Dashboard is highly customizable, making it suitable for a wide range of industries and functions, including sales, finance, operations, and human resources. Users can tailor the dashboard to track specific KPIs relevant to their business objectives, such as revenue growth, customer satisfaction, operational efficiency, or employee performance. By offering real-time insights into these metrics, the dashboard facilitates quick responses to performance fluctuations, ensuring that goals are consistently met or adjusted as necessary.
One of the key features of an Excel KPI Dashboard is its ability to present complex data through visual elements like charts, graphs, and gauges. These visualizations make it easier for users to identify patterns, compare performance periods, and understand the impact of their decisions. The dashboard can also incorporate conditional formatting to highlight when KPIs exceed or fall below predetermined thresholds, triggering alerts for immediate action.
Furthermore, the Excel KPI Dashboard supports drill-down capabilities, allowing users to delve into the details behind the summary data. This feature is crucial for diagnosing issues, understanding root causes, and developing targeted strategies for improvement.
In summary, an Excel KPI Dashboard is an indispensable tool for any organization committed to data-driven management. By providing a clear, concise view of performance across multiple dimensions, it empowers businesses to achieve greater efficiency, effectiveness, and competitive advantage.
- Browse by Categories, Browse by Industry, Financial Excel Model, Financial Excel Template, Retail Industry Financial Model, Retail Industry Solutions, Startup Financial Model
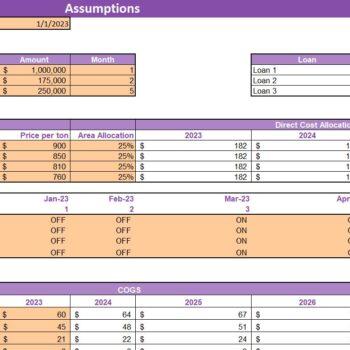
Soybeans Farming Excel Financial Model
Original price was: $140.$84Current price is: $84.